Woodcreek College Exams
Just as end of year exams finish, you join Woodcreek College as a data analyst  . Your new colleagues are eager to
receive the results of their students
. Your new colleagues are eager to
receive the results of their students  as well as any other insights you can share.
Your supervisor provides you with three CSV files 1
These CSV files contain all the data you need to get started with your analysis, but you'll need to prepare your data before you can get stuck in.
|Student_ID   | math_score| reading_score| writing_score|
|:------------|----------:|-------------:|-------------:|
|4C25D2D418EC |         48|            28|            23|
|592288068D0E |         36|            29|            23|
|493EFBA51280 |         20|            29|            25|
...
|0DB4F0C08BD8 |        100|           100|           100|
|947C271E8FDC |         90|           100|           100|
|0B34820D8833 |         99|           100|           100|
|Student_ID   | parental_level_of_education| lunch_plan| test_preparation_course|
|:------------|---------------------------:|----------:|-----------------------:|
|43E1519F2042 |                           1|          2|                       0|
|AD59DD156E95 |                           1|          2|                       0|
|4802DCF935A0 |                           1|          2|                       0|
...
|2E57E622CA59 |                           6|          2|                       1|
|04495CEFE495 |                           6|          2|                       1|
|630BB8BB6794 |                           6|          1|                       1|
|Student_ID   |Gender |Year_Group |
|:------------|:------|:----------|
|CC2F443C5C99 |F      |Group A    |
|22E7A1158638 |F      |Group A    |
|AE79A2647B1A |F      |Group A    |
...
|211BCA3E5FEE |M      |Group E    |
|B3FC85821768 |M      |Group E    |
|ABAD74B3A465 |M      |Group E    |
Your supervisor gives you a heads up that the data within student_exam_survey.csv has numerically encoded values, and you'll need to use the keys below to decode them.
- 1 = Some High School
- 2 = High School
- 3 = Some College
- 4 = Associate's Degree
- 5 = Bachelor's Degree
- 6 = Master's Degree
- 1 = Free/Reduced
- 2 = Standard
- 0 = None
- 1 = Completed
1) Data Preparation
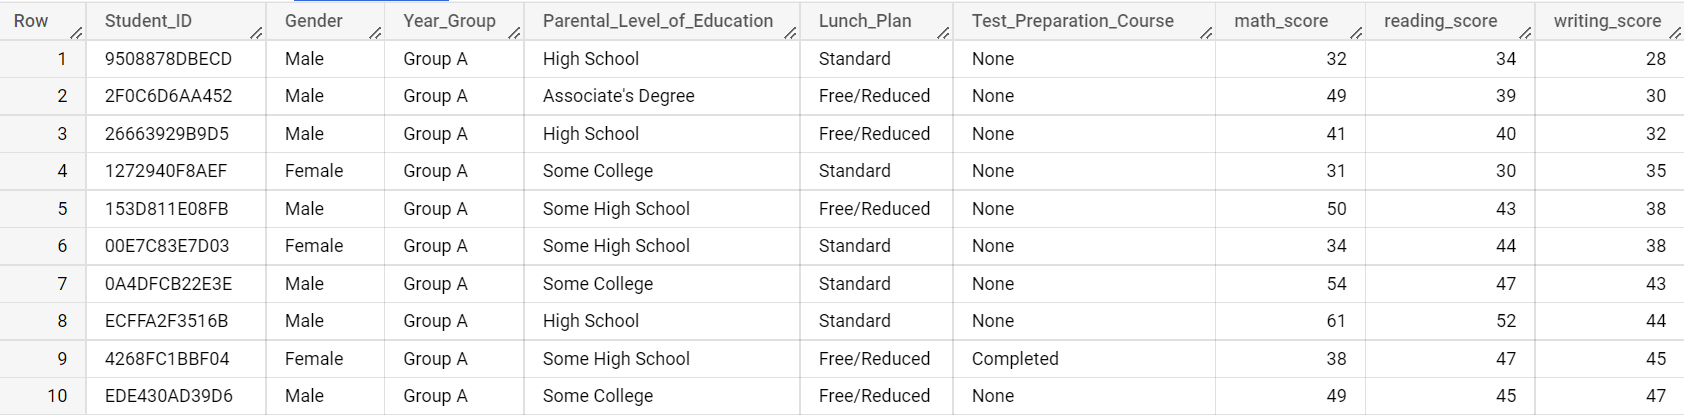
Ingest the three CSV files into BigQuery, them combine them to produce a unified table named Student_Results_Combined.
Reformat the coded values into their proper names using the provided keys above. For example, convert 1s in the Lunch
Plan column of student_exam_survey.csv to "Free/Reduced". For the sake of readability, also transform the
gender vales (M/F) to (Male/Female).
Expected Output
Hints
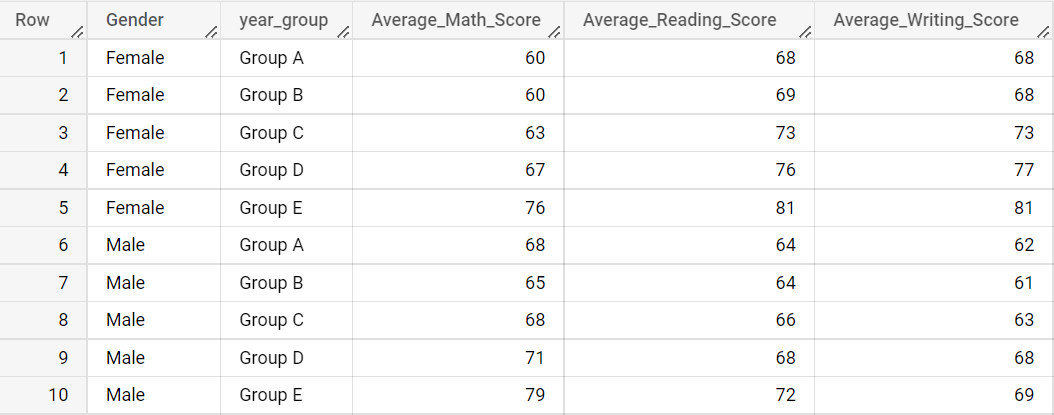
2) Average Student Performance
Using your recently created table, produce a high level report which provides the average math, reading and writing scores by gender and year_group. Ensure these metrics remain as integers, meaning zero decimal places in your results.
For readability, order your results by gender and then year_group.
Expected Output
Hints
-
Dataset Source: http://roycekimmons.com/ ↩