Dates vs Derivatives Problem
Thirty college students were surveyed on
- the number of derivatives they've calculated in the past year and
- the number of dates they've been on in the past year
import random

random.seed(1)
derivatives = [random.randrange(0, 250) for i in range(30)]
dates = [random.randrange(0, max(50 - d, 3)) for d in derivatives]

print(derivatives)
# [34, 145, 216, ..., 178, 114, 68]

print(dates)
# [7, 2, 0, ..., 0, 1, 2]
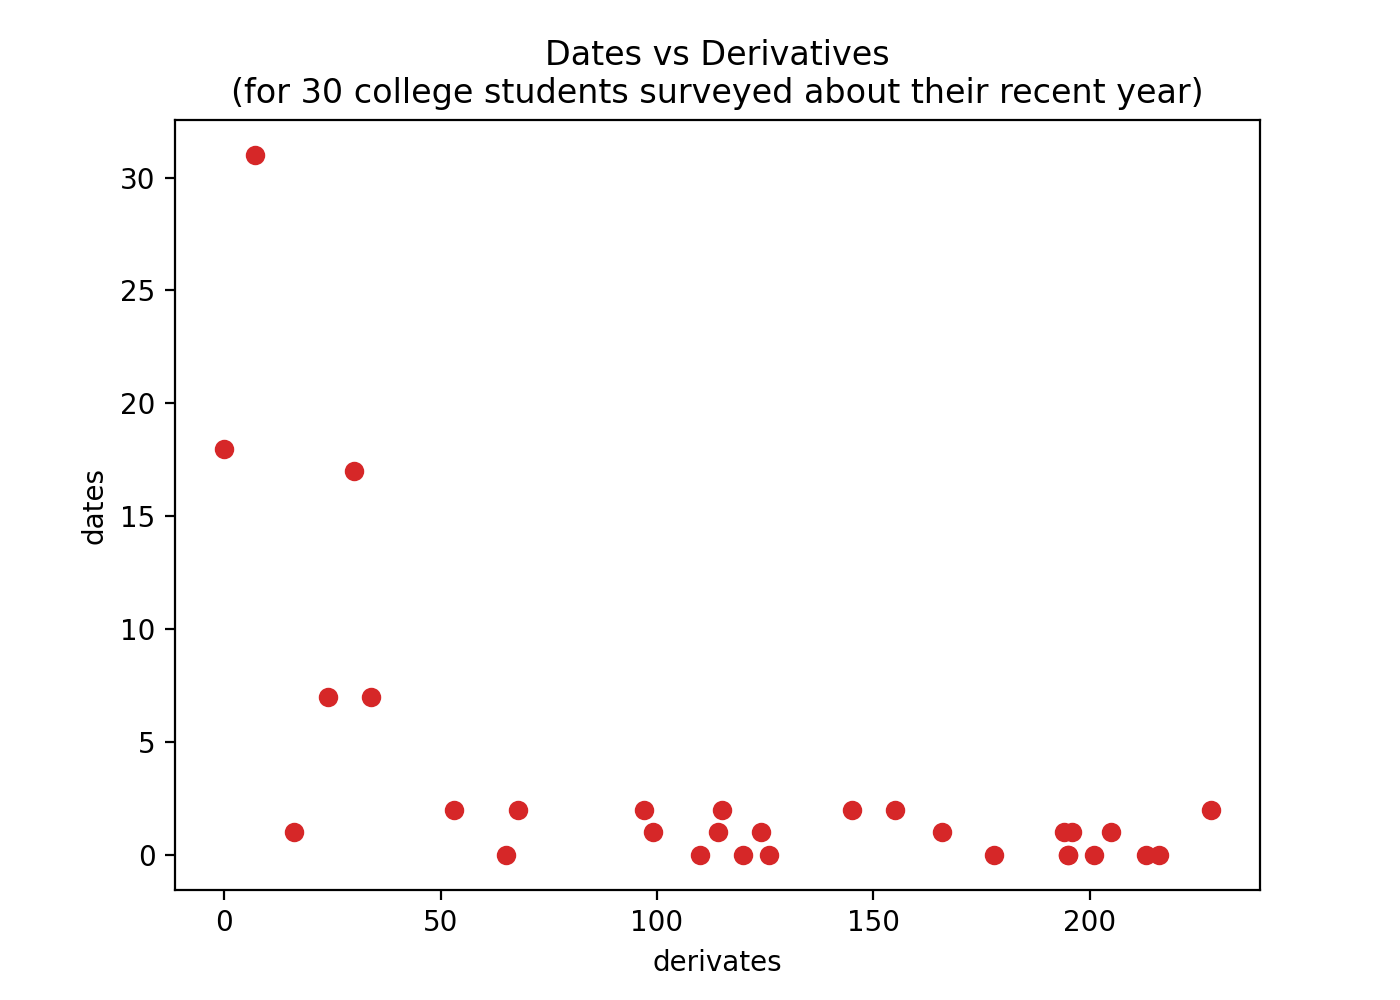
Build a scatter plot of this data with
- derivatives on the x axis and dates on y axis (with labeled axes)
- points using the color 'tab:red'
-
the title:
Dates vs Derivatives
(for 30 college students surveyed about their recent year)
Show the plot