Screen Time Problem
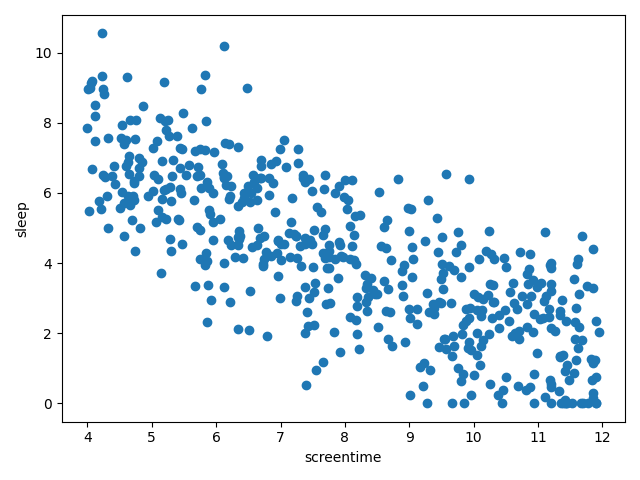
You suspect there's a linear relationship between how much daily screen time a person gets and how many hours they sleep. You acquire the data to investigate.
import numpy as np

rng = np.random.default_rng(123)
screentime = rng.uniform(low=4, high=12, size=500)
sleep = np.clip(-0.8*screentime + 10.5 + rng.normal(loc=0, scale=1.5, size=len(screentime)), 0, 24)

print(screentime[:5])  # [9.45881491 4.43056815 5.76287898 5.47497449 5.40724721]
print(sleep[:5])       # [2.87662678 6.24164643 6.14092628 4.54709214 5.24364   ]
Plot
import matplotlib.pyplot as plt

fig, ax = plt.subplots(layout='tight')
ax.scatter(screentime, sleep)
ax.set_xlabel('screentime')
ax.set_ylabel('sleep')
Fit a simple linear regression model to this data using gradient descent with the help of torch.autograd.
View the pseudocode
Initialize m and b (for the model y = mx + b)
Convert sleep and screentime to tensors
For 10K iterations:
  Calculate yhat = m * screentime + b (predictions based on current m, b)
  Calculate the loss (root mean square error)
  Use reverse mode differentiation to determine the gradient of the loss with respect to m and b
  Update m and b (gradient step)