Jerky For Dogs Problem
You sell homemade beef jerky for dogs at your local farmers market  . After a few weeks of selling, you decide to
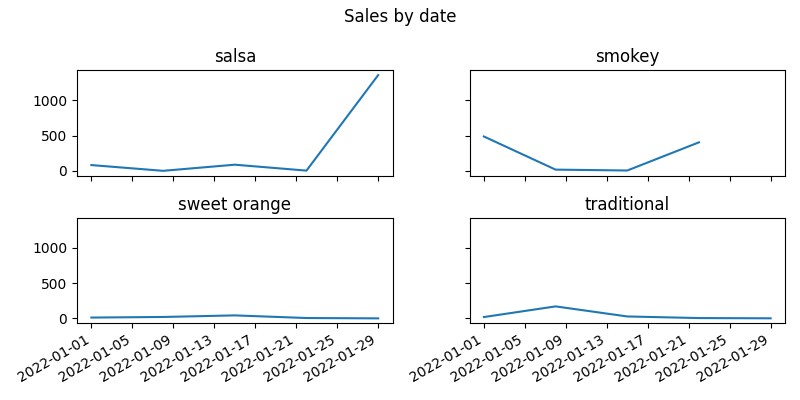
analyze your sales by date per flavor.
. After a few weeks of selling, you decide to
analyze your sales by date per flavor.
import numpy as np

# Create a random number generator
rng = np.random.default_rng(1234) # (1)!

# Make data
dates = ['2022-01-01', '2022-01-08', '2022-01-15', '2022-01-22', '2022-01-29']
dates = np.repeat(np.array(dates, dtype='datetime64[D]'), repeats=4)
flavors = np.tile(['traditional', 'salsa', 'sweet orange', 'smokey'], reps=5)
sales = np.round(rng.lognormal(mean=3, sigma=2.5, size=len(dates)), 2)
dates, flavors, sales = dates[:-1], flavors[:-1], sales[:-1]

print(dates)   # ['2022-01-01'   '2022-01-01' ... '2022-01-29'   '2022-01-29']
print(flavors) # [     'salsa' 'sweet orange' ...      'salsa' 'sweet orange']
print(sales)   # [      82.02           11.43 ...      1358.36           0.09]
- See [
numpy.random.default_rng()][default_rng]
Build a plot like the one below showcasing sales vs date, with a separate Axes for each flavor. Note that each
Axes has the same x and y scale!
Show the plot
Suppress Scientific Notation
Use np.set_printoptions(suppress=True) to suppress scientific notation in NumPy.
scientific notation on
print(sales[[16,17]])
# [9.10000e-01 1.35836e+03]
scientific notation off
np.set_printoptions(suppress=True)
print(sales[[16,17]])
# [   0.91 1358.36]