Beginner
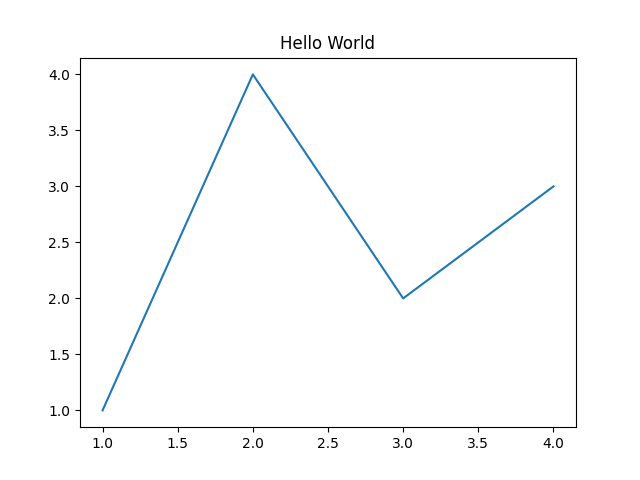
Hello World
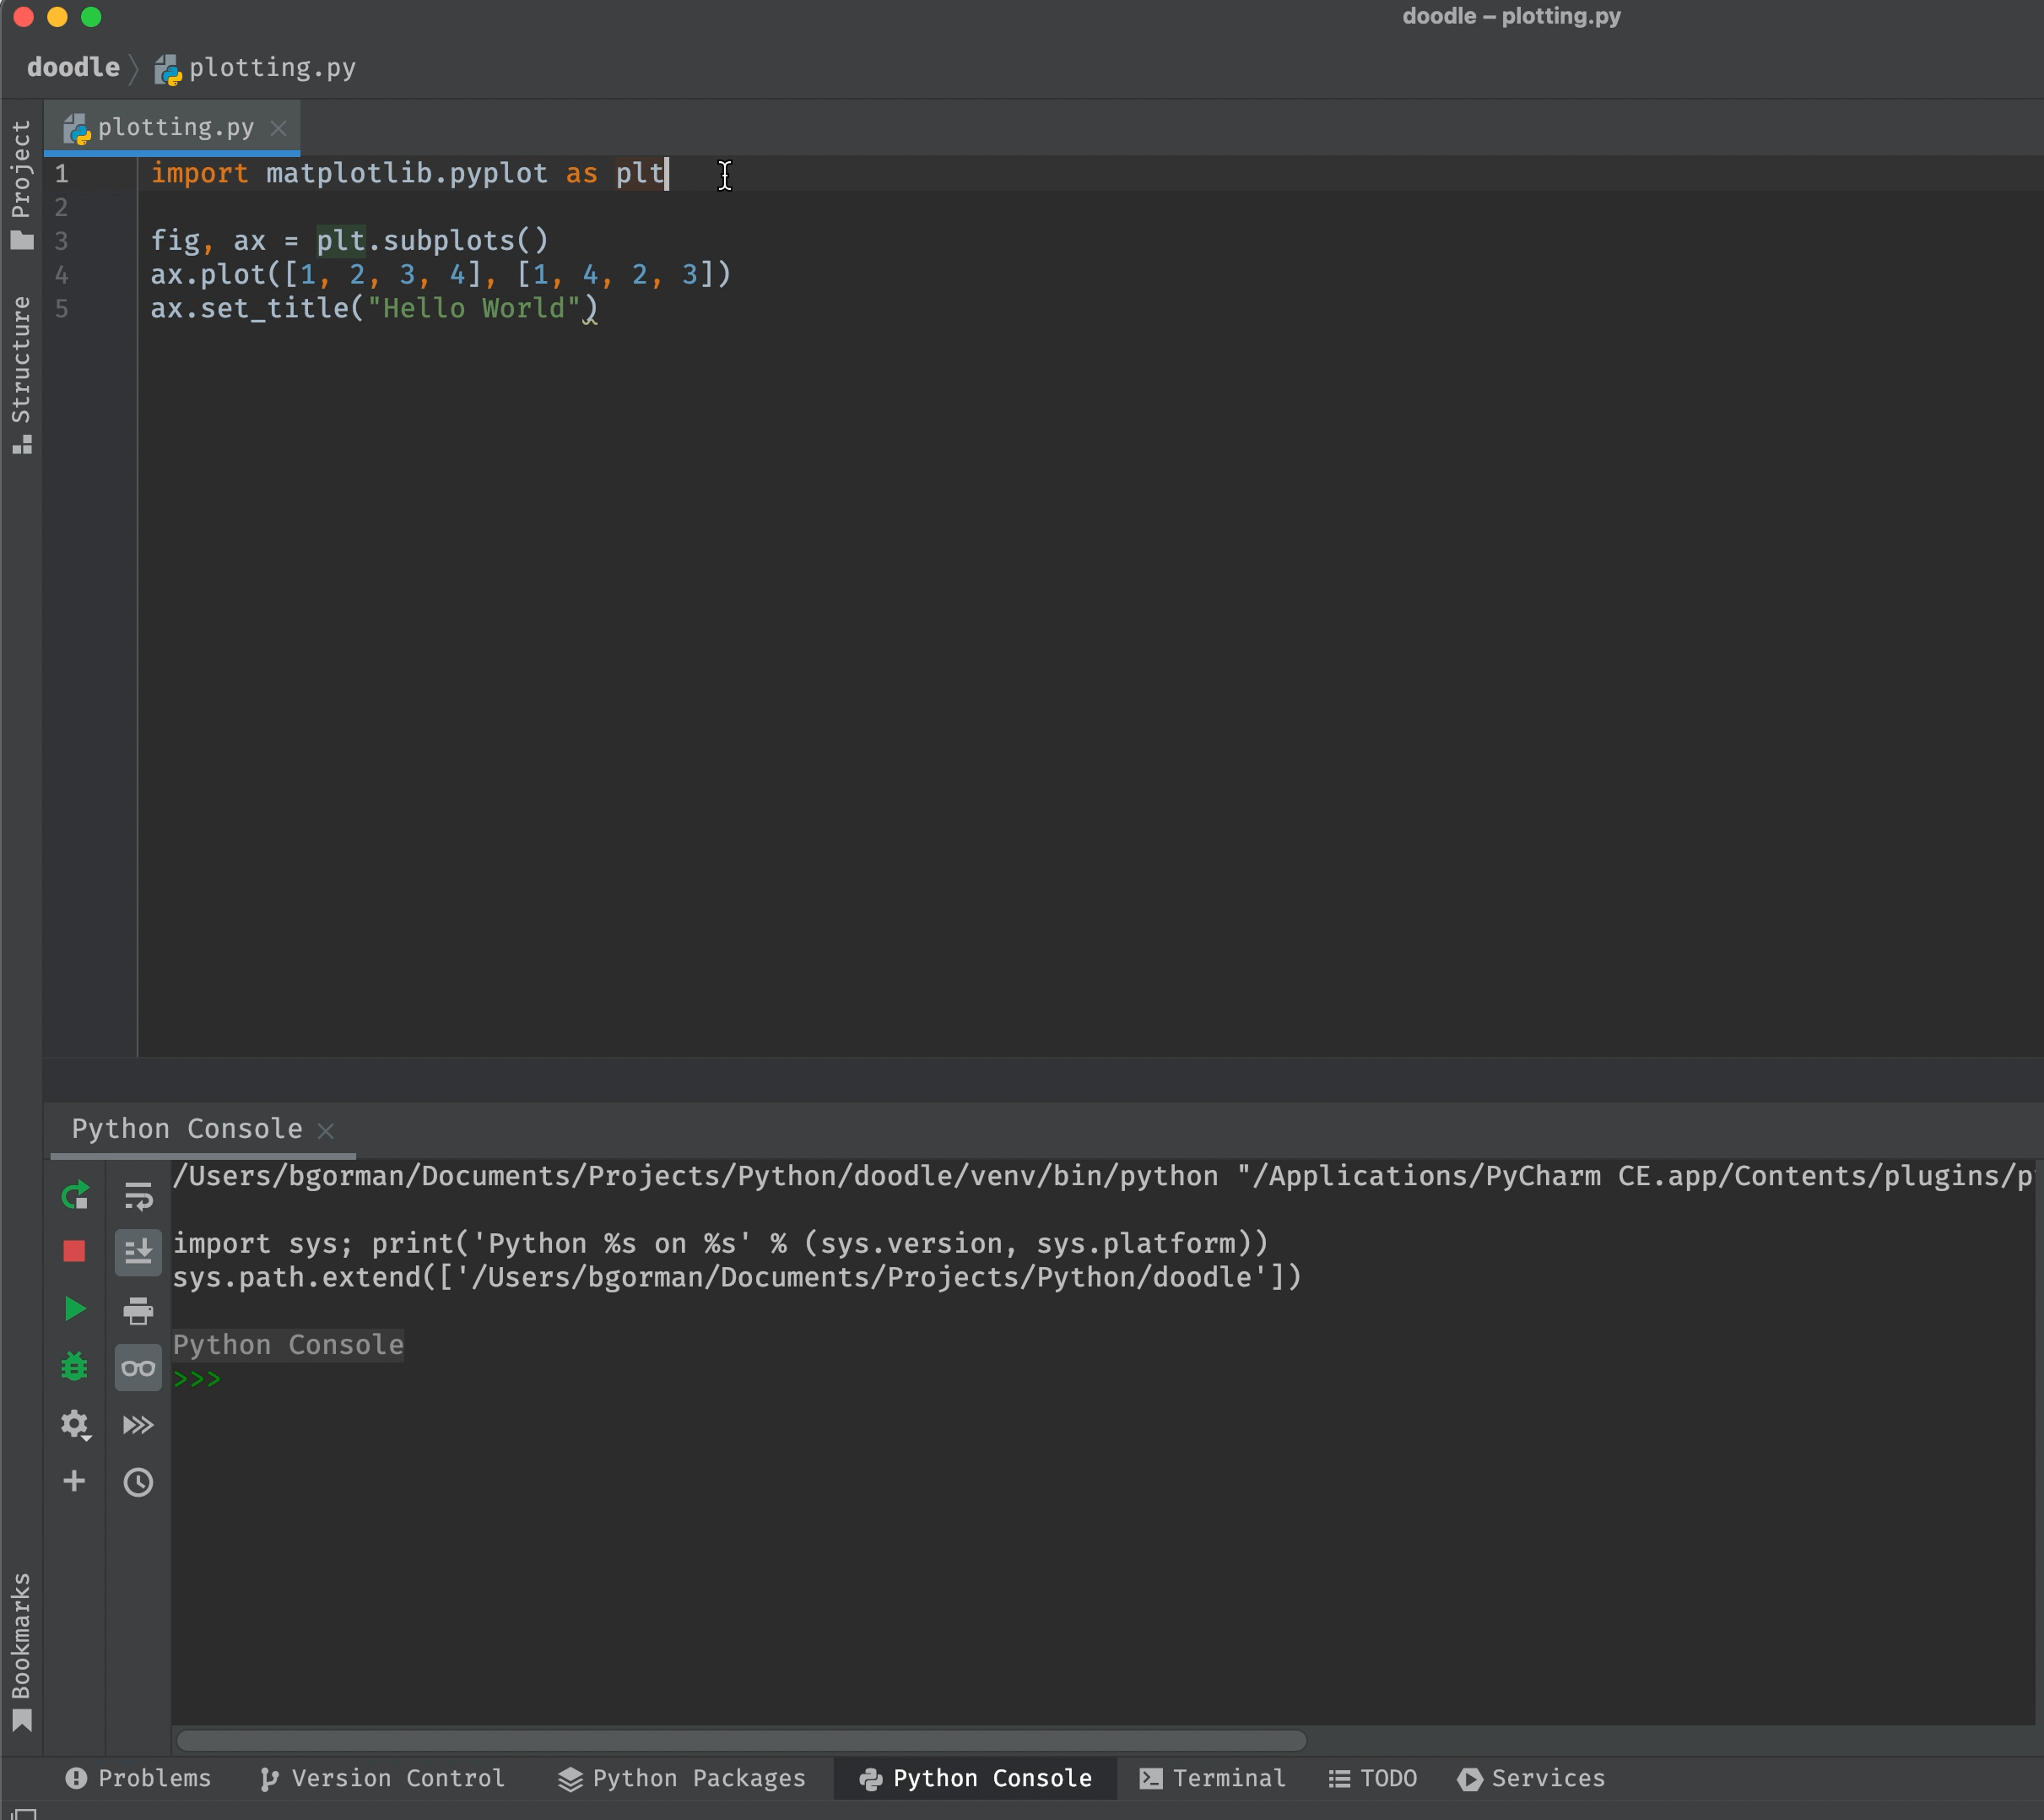
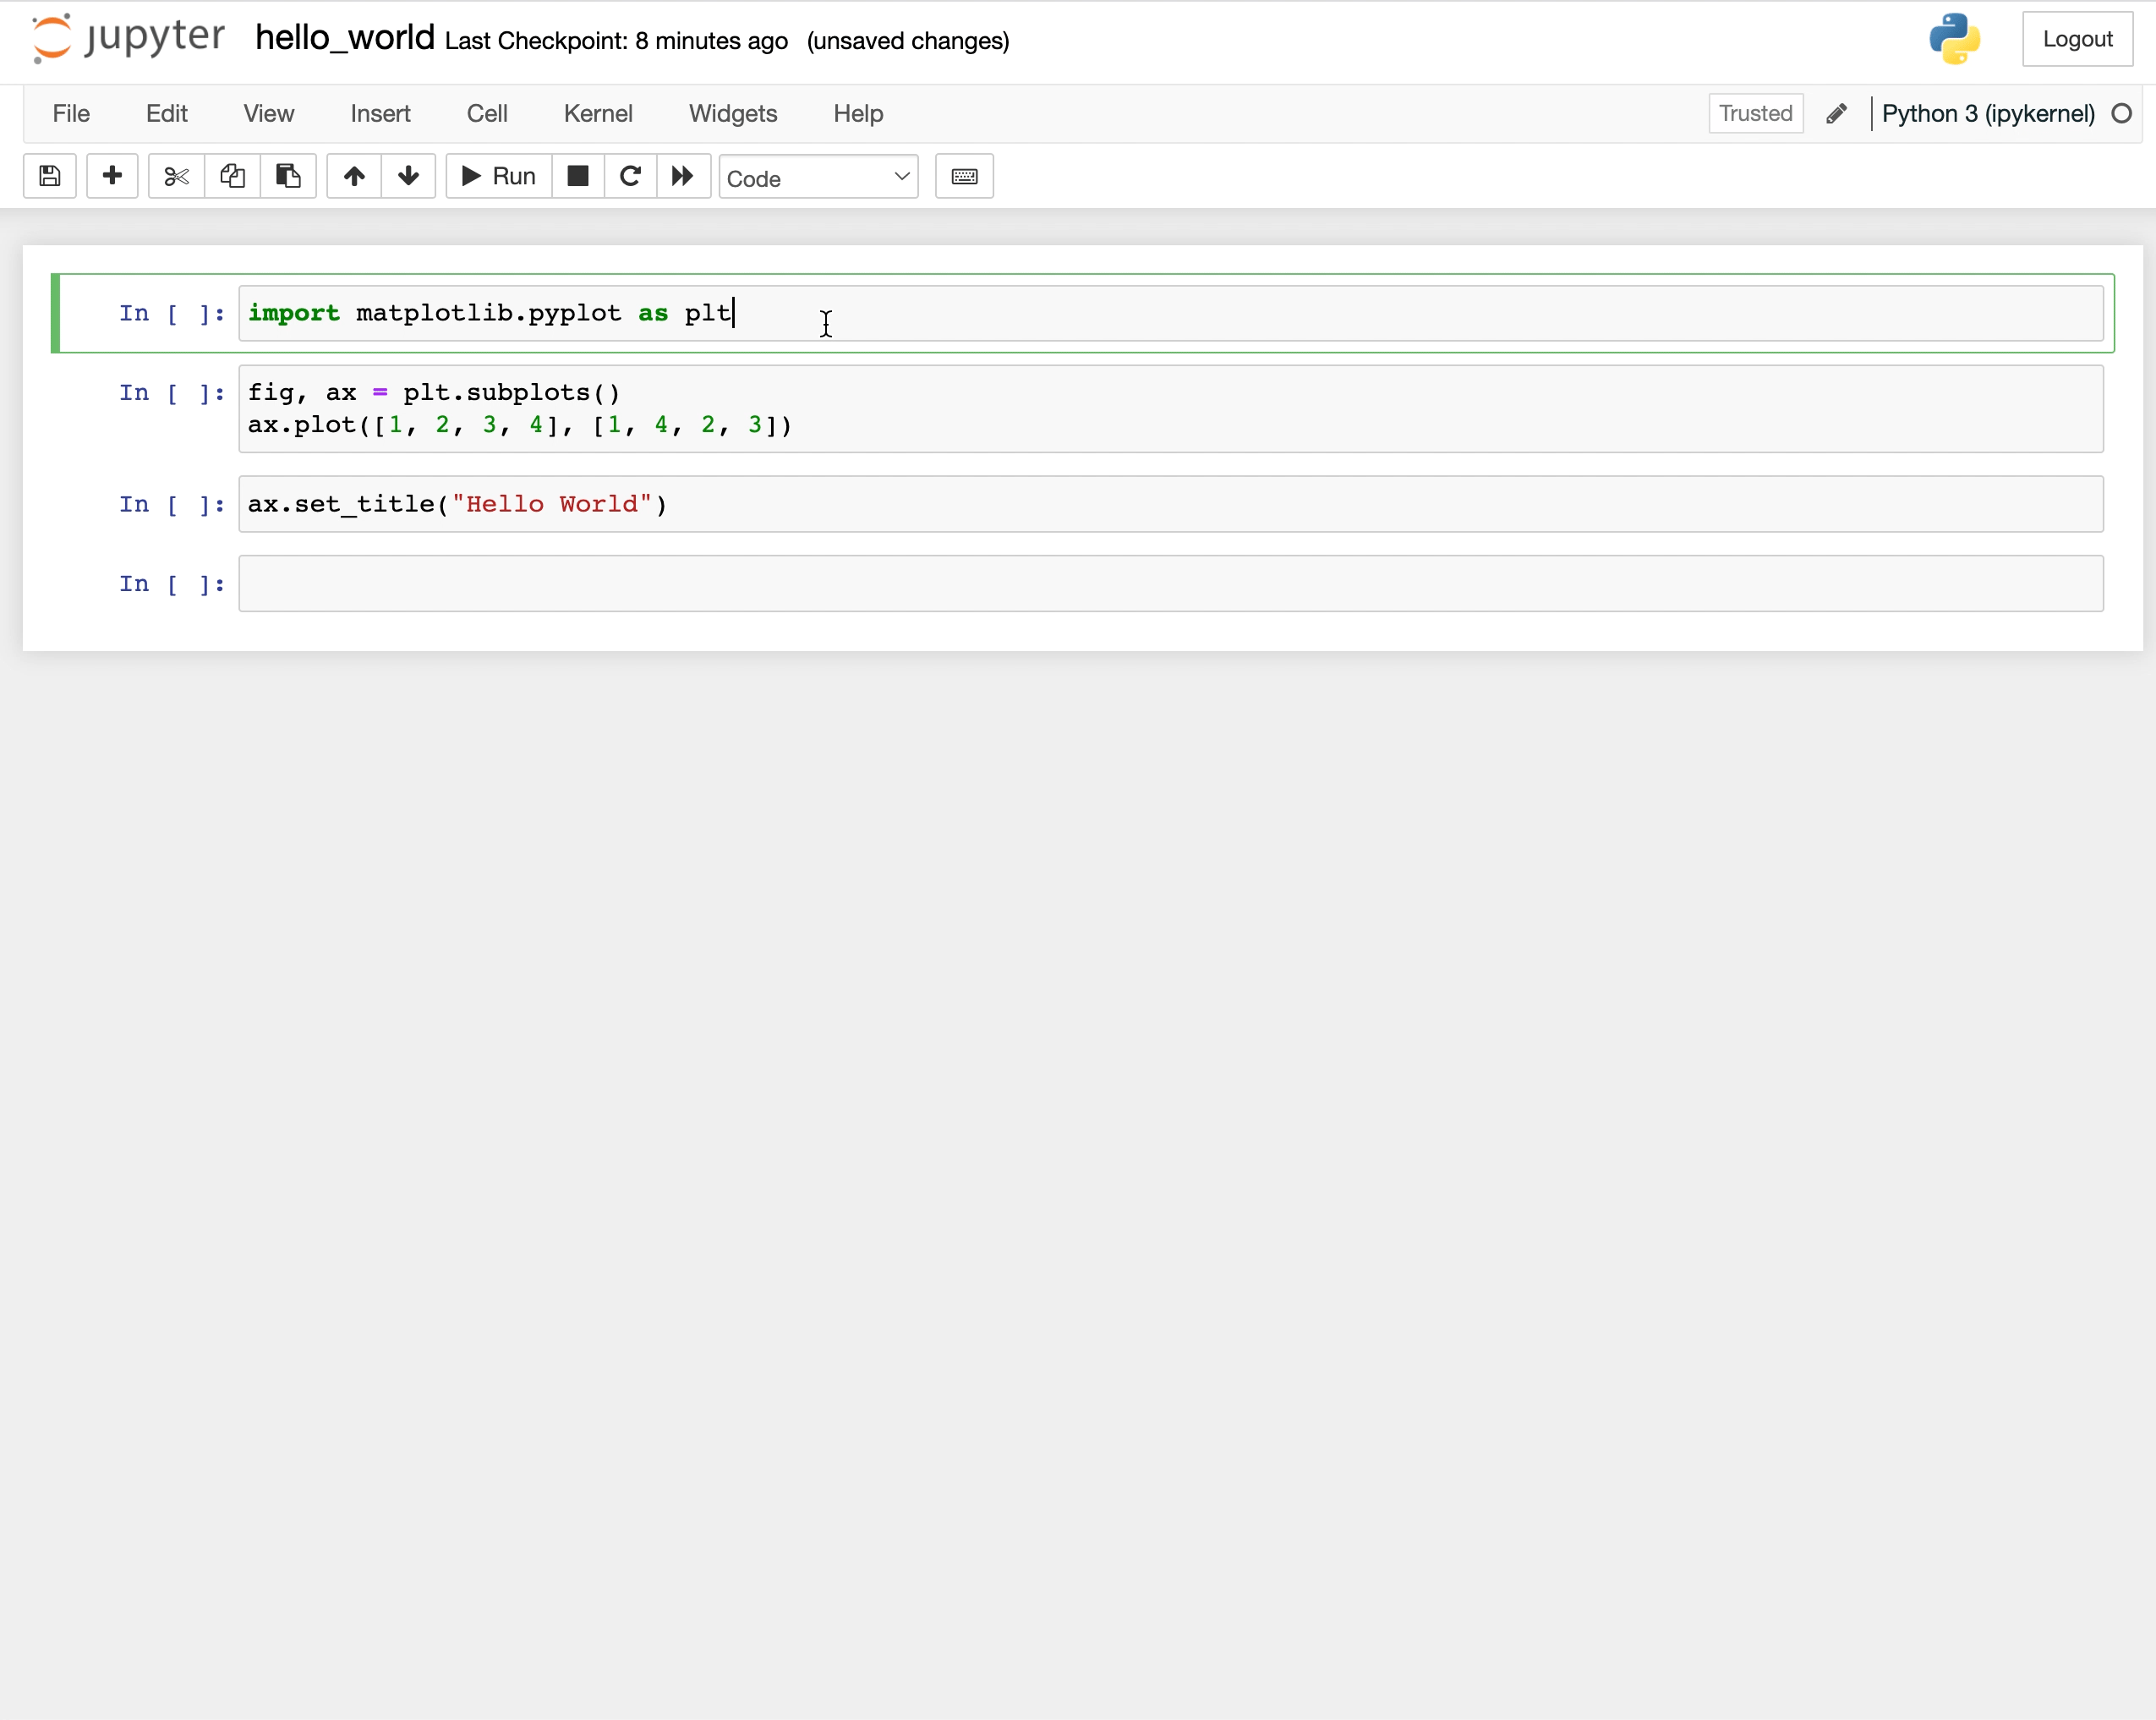
Let's make our first plot with Matplotlib.
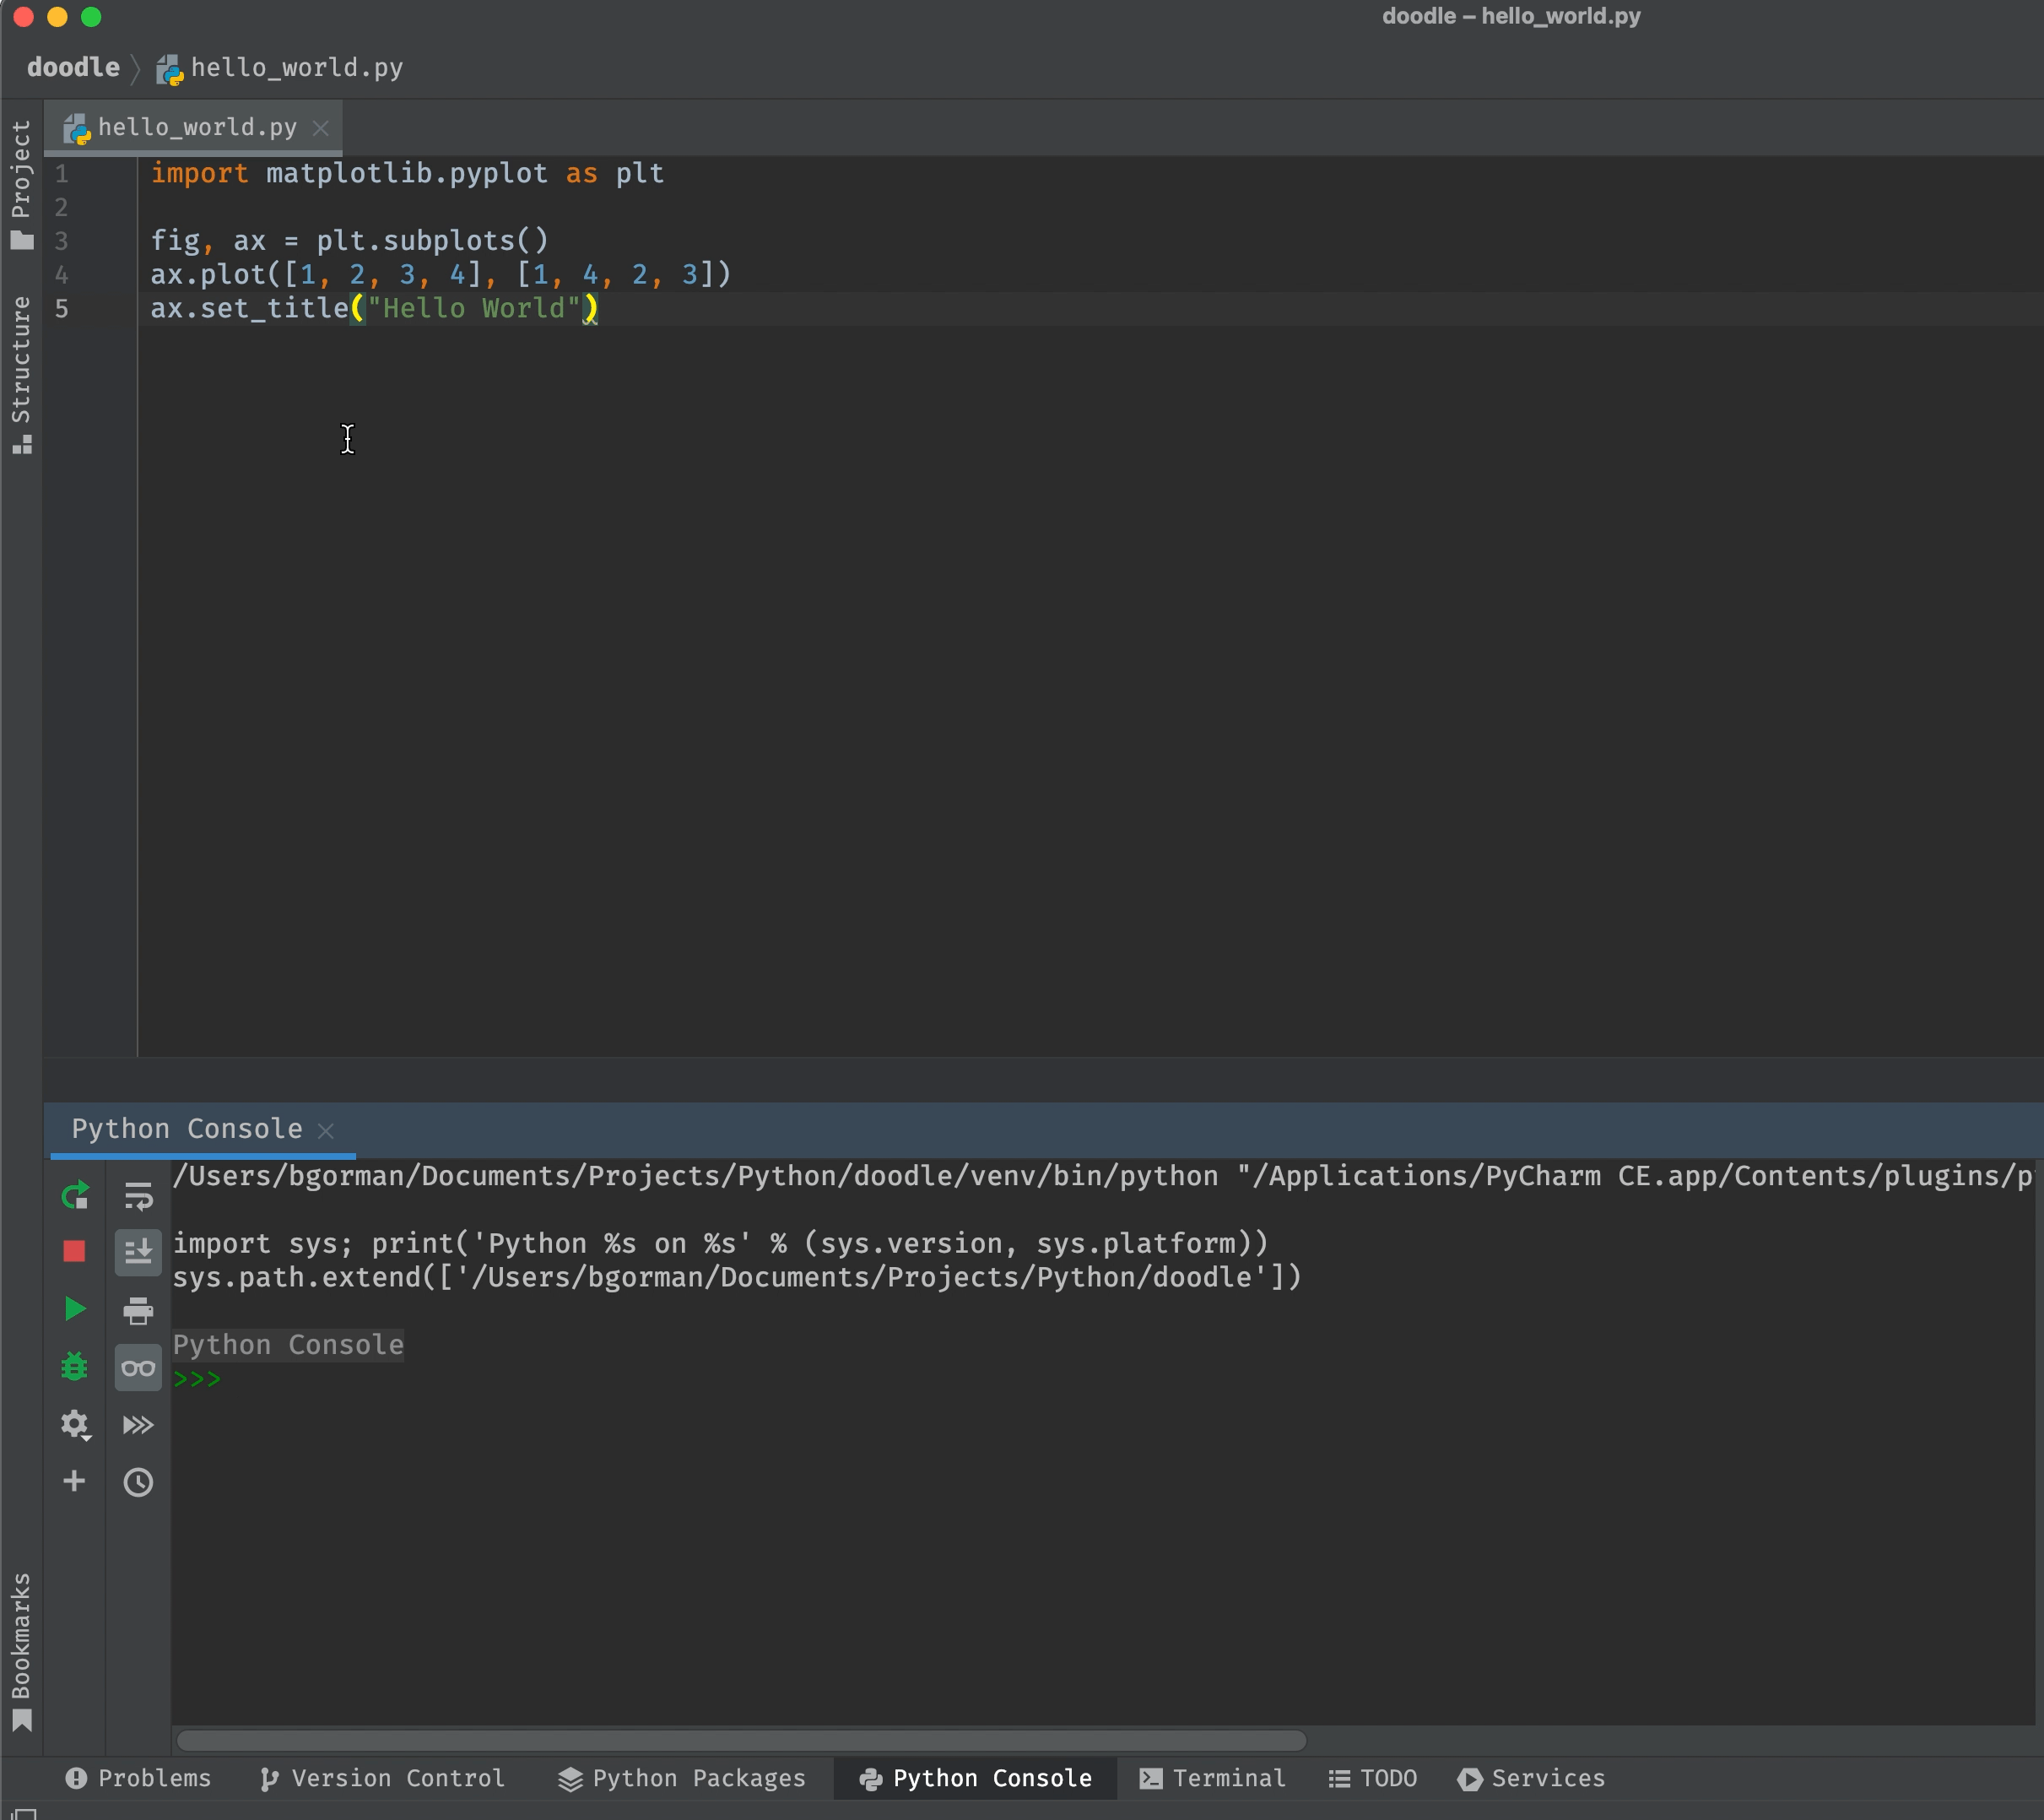
import matplotlib.pyplot as plt

fig, ax = plt.subplots()
ax.plot([1, 2, 3, 4], [1, 4, 2, 3])
ax.set_title("Hello World")
How to run Matplotlib code
How you build plots in Matplotlib differs slightly depending on how you're running Python..
Matplotlib can be run in two modes: interactive mode and non-interactive mode.
Interactive Mode
With interactive mode, the plot opens in a separate GUI window as soon as you instantiate a figure with
fig, ax = plt.subplots(). The plot is then updated line-by-line.
Non Interactive Mode
With non interactive mode, your plot doesn't appear until you explitly show it with plt.show().

Tip
Use plt.show(block=False) to prevent the GUI window from blocking the python shell. This allows you to run
additional python commands while the GUI window is open.
How do I know which mode I'm using?
Run plt.isinteractive() to check if you're in interactice mode or non-interactive mode.
How do I change the mode I'm in?
Run plt.interactive(True) to activate interactive mode and plt.interactive(False) to deactivate it.
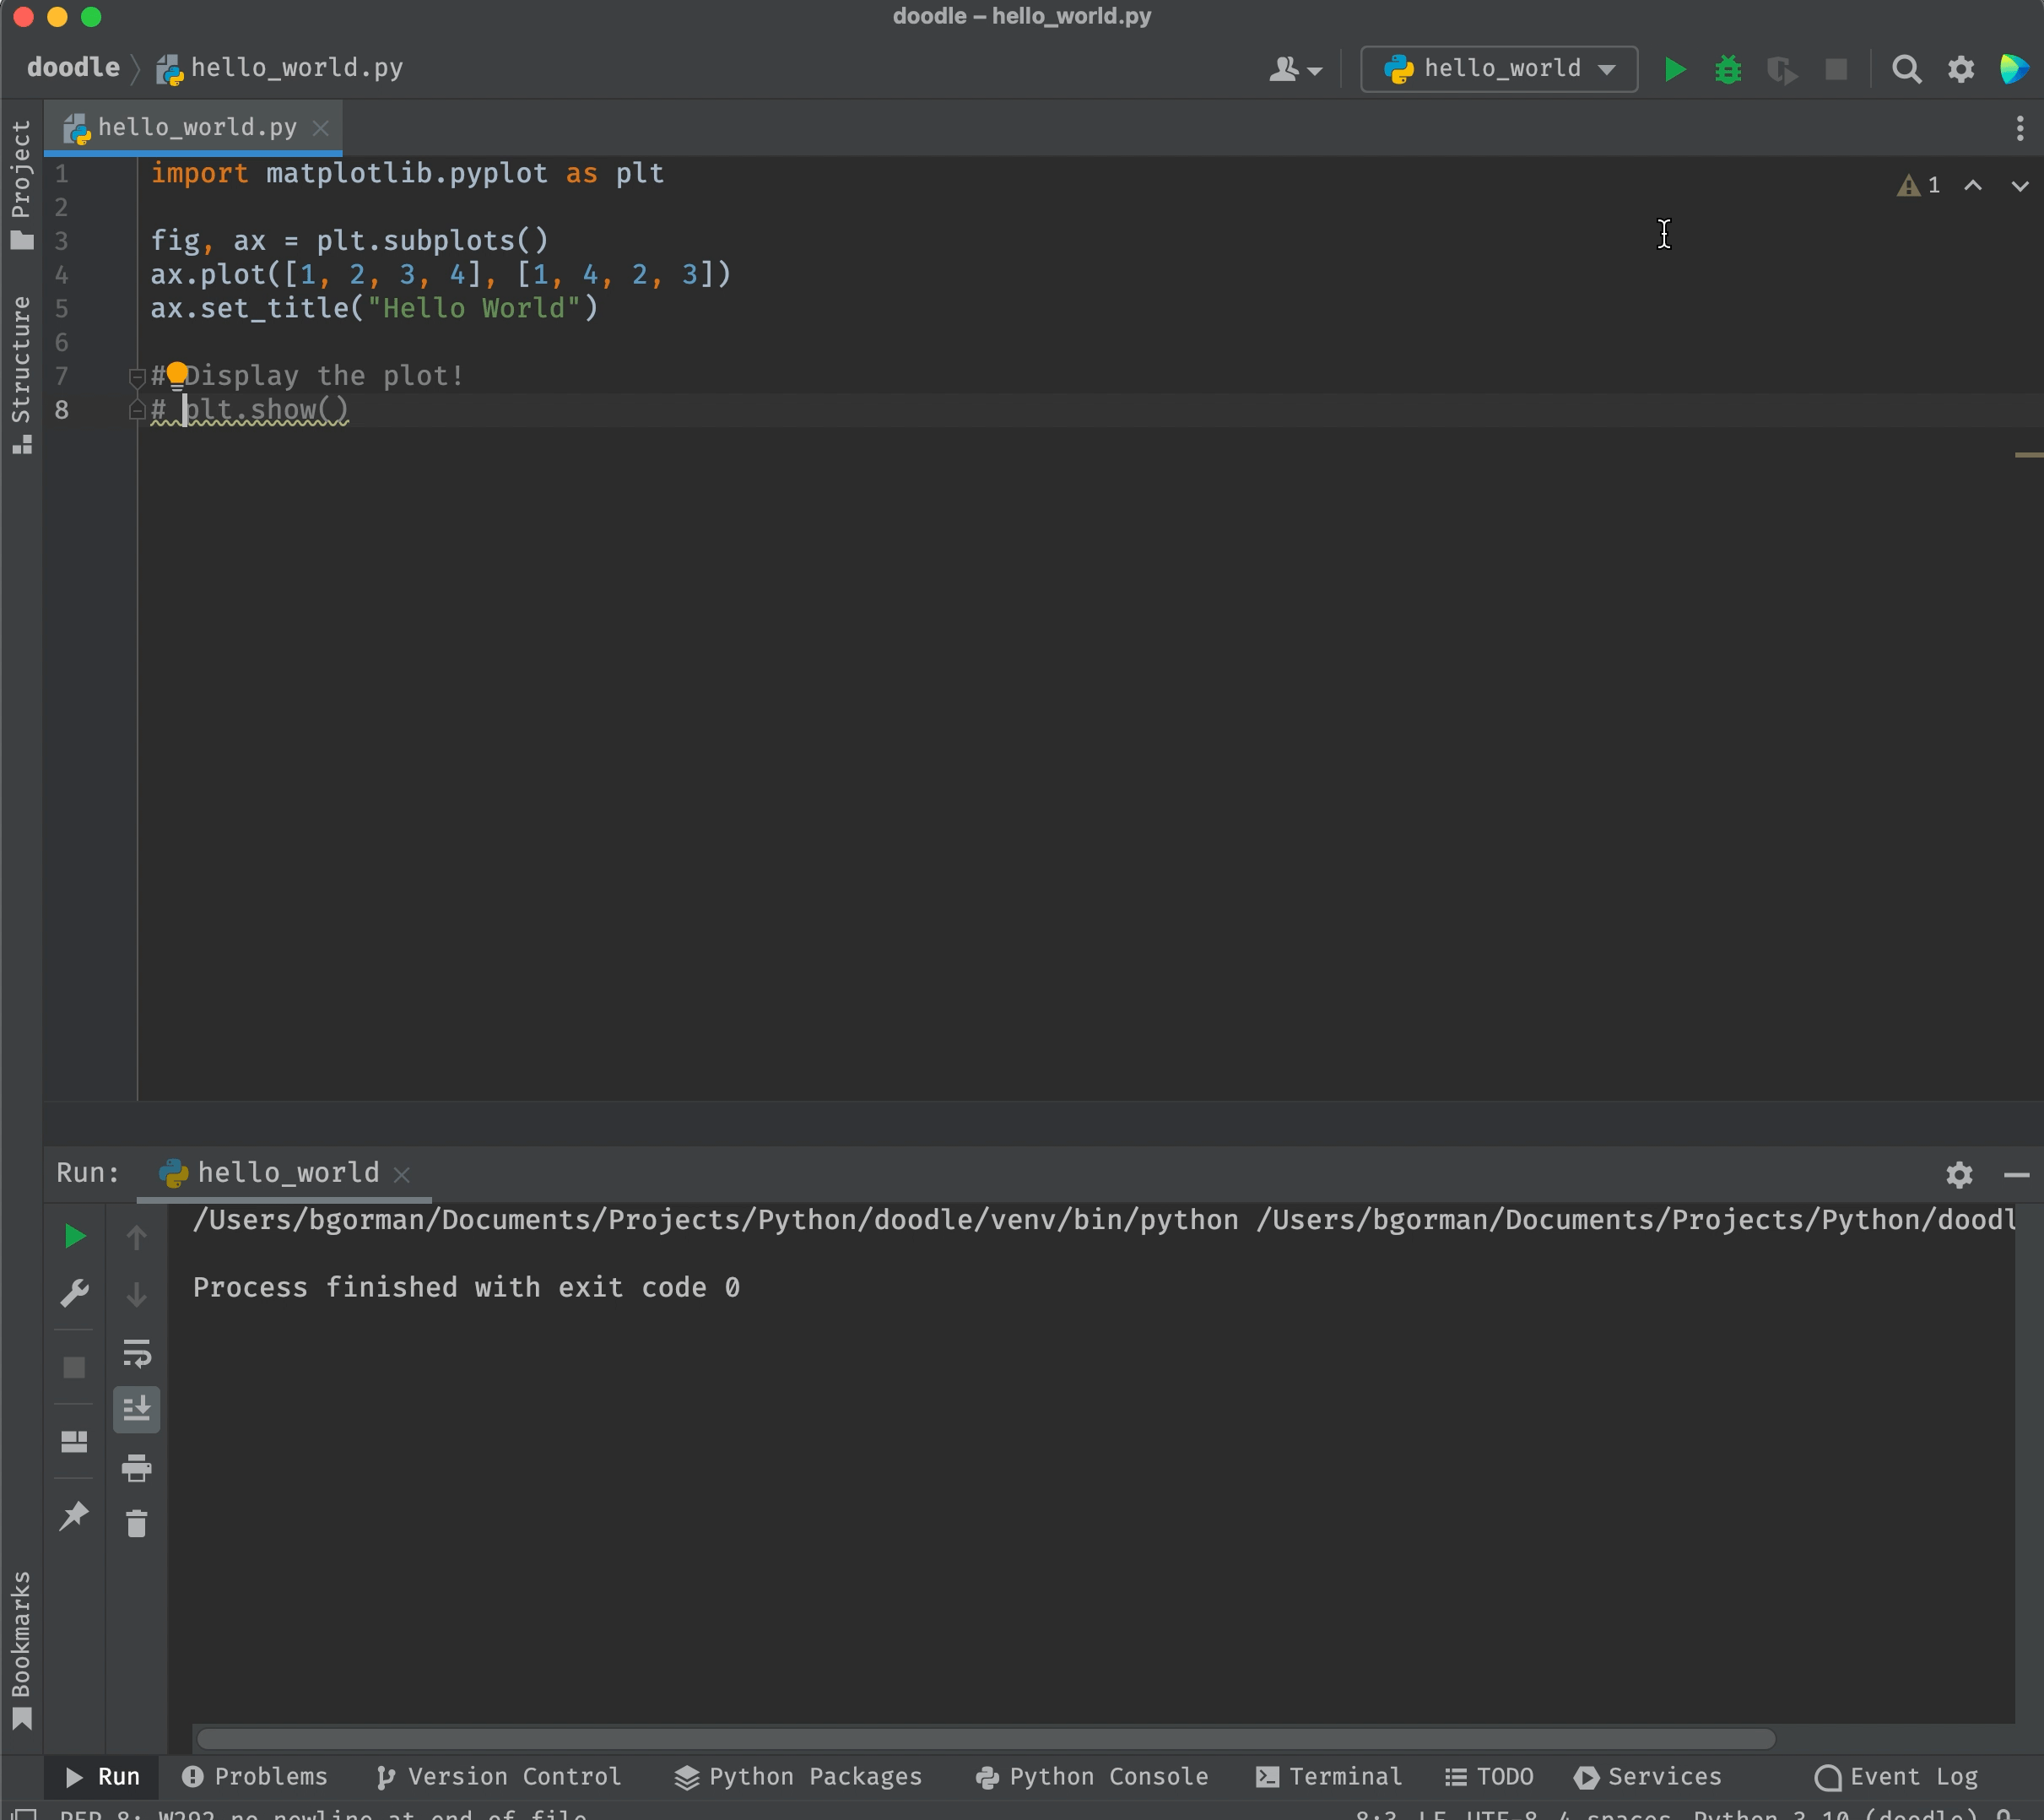
When you execute a Python script, you need to use plt.show() for your plot to appear in a separate GUI window.
For example,
import matplotlib.pyplot as plt

fig, ax = plt.subplots()
ax.plot([1, 2, 3, 4], [1, 4, 2, 3])
ax.set_title("Hello World")

# Display the plot!
plt.show()
Line-By-Line Execution
If you use line-by-line execution in Pycharm, your plot should open in a separate GUI window as soon as you create a
figure with fig, ax = plt.subplots(). The plot is then updated line-by-line.
Turn off interative mode
If you only want your plot(s) only to appear when you explicity tell them to via plt.show(), you might try turning off interactive mode via plt.interactive(False). However, Pycharm always uses interactive mode regardless of this setting. You may consider using a different Matplotlib backend to get around this issue.
Chunk Execution Sometimes it's preferable to build a plot in one go, which you can do by highlighting and executing a block of code (i.e. a chunk).
Executing a Python Script
You can also execute entire Python scripts from PyCharm. In these cases, you need to include plt.show() after creating your plot for it to appear.
import matplotlib.pyplot as plt

fig, ax = plt.subplots()
ax.plot([1, 2, 3, 4], [1, 4, 2, 3])
ax.set_title("Hello World")

# Display the plot!
plt.show()
In Jupyter / Ipython notebooks, Plots are rendered inline.
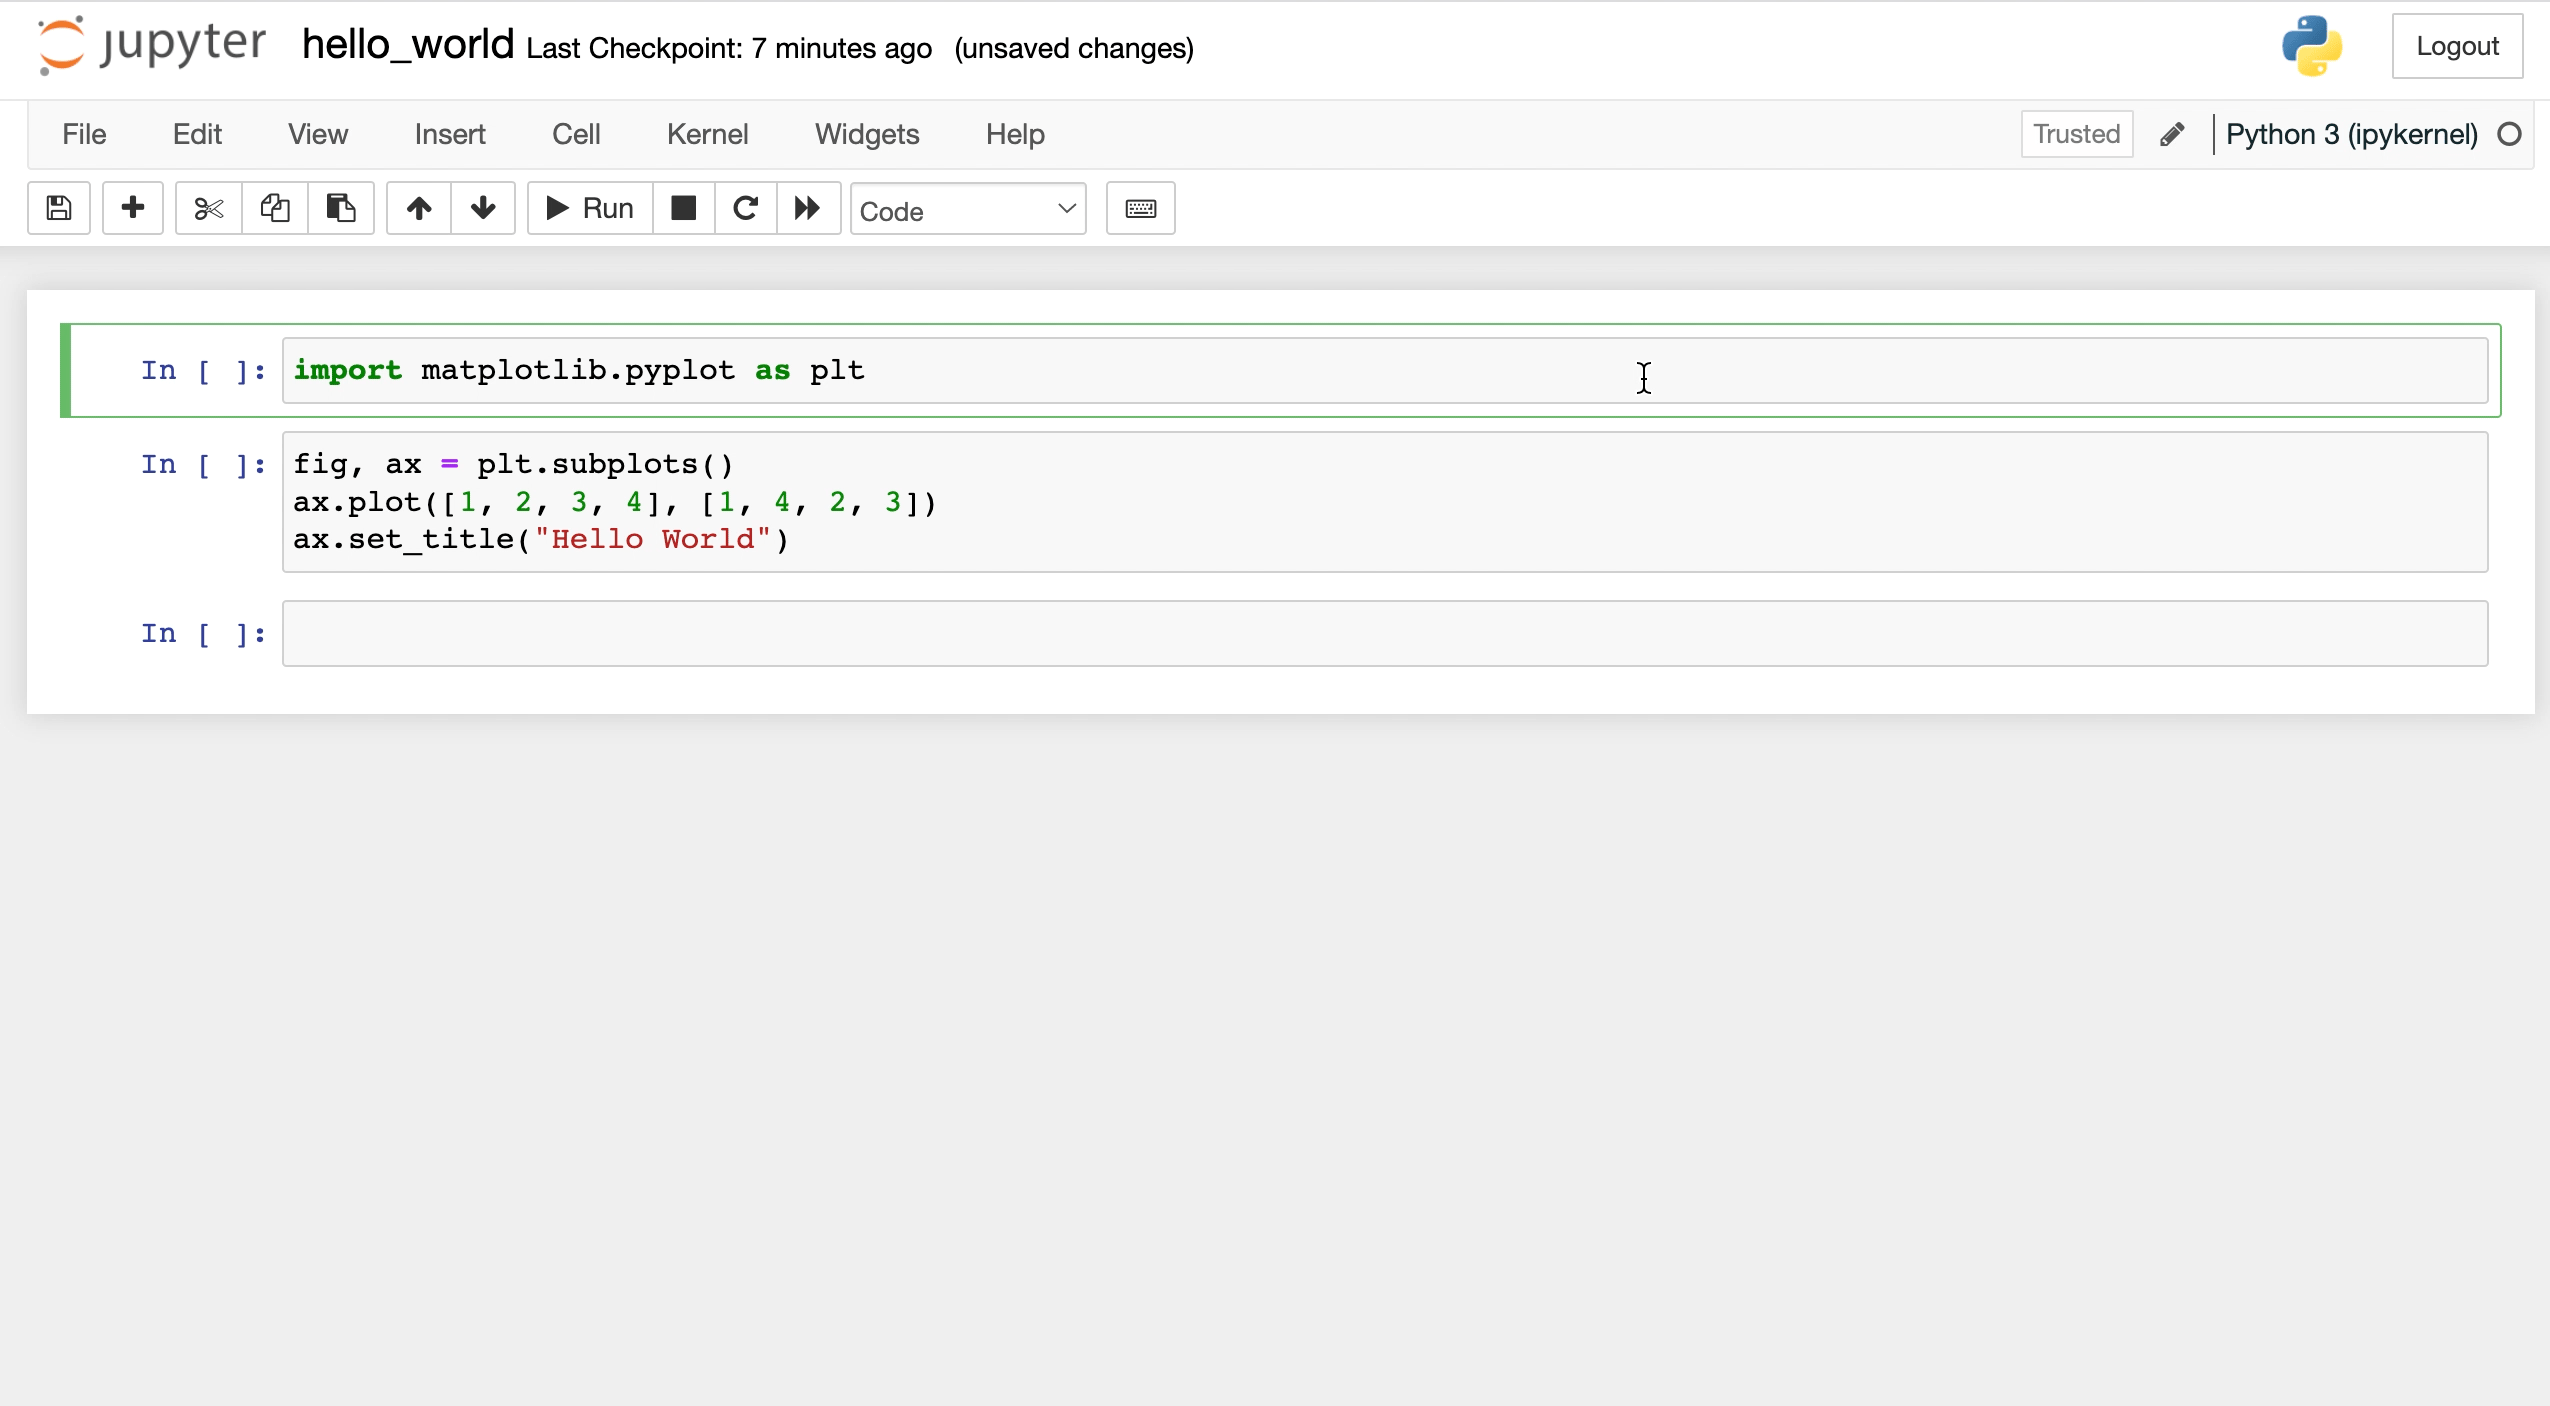
If you want modify a figure in a separate cell from where you created it, reference its name (e.g. fig).
For example, here we build a figure, plot it, then modify its title and plot it again.
Fundamental Concepts
Understand these fundamental concepts and your Matplotlib journey will go smoothly. Skip this section and prepare to struggle!
Matplotlib Backend
Matplotlib automatically chooses a "backend" for rendering plots. You can see which back end it chose via
plt.get_backend().
Sometimes you may want to change the backend, for example
- if you're building a GUI application
- if you want to prevent plots from rendering inline or in a separate GUI window
Figure vs Axes
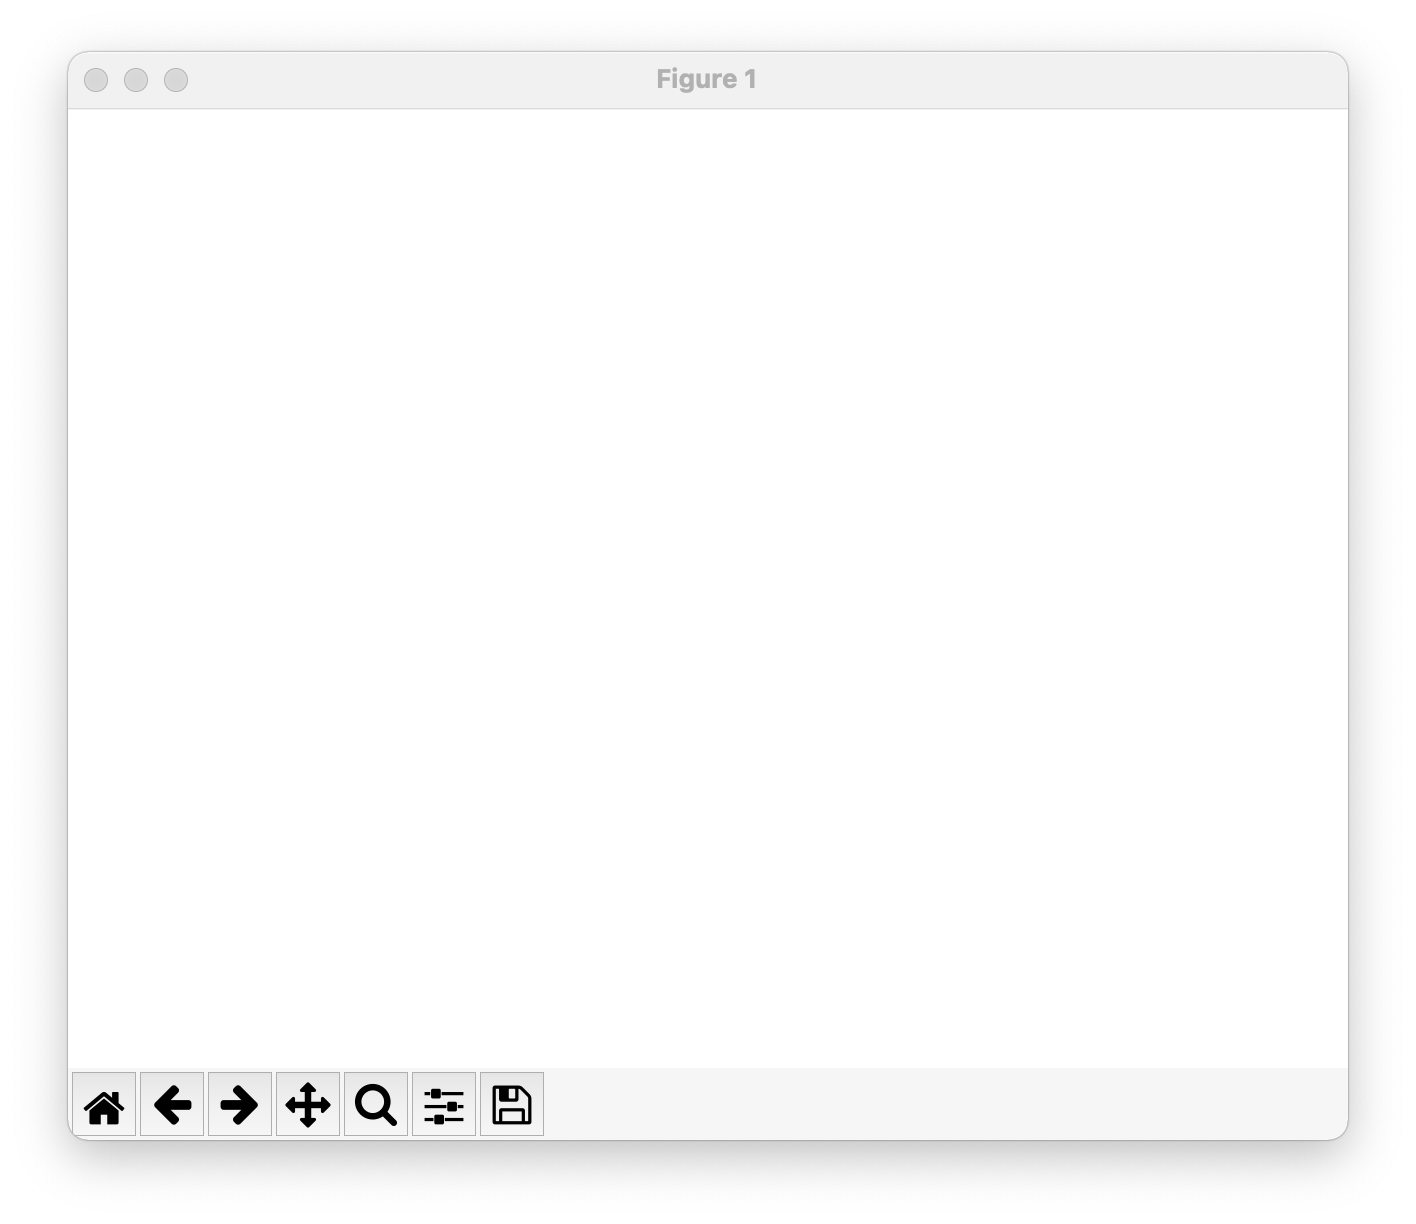
A figure is like a blank canvas, and an axes is like a picture on that canvas. When you create a figure in interactive mode, you'll notice that matplotlib displays a bank white screen.
import matplotlib.pyplot as plt
fig = plt.figure()
Figures contain none, one, or multiple axes. Notice the .axes attribute of the figure created above is an empty list.
print(fig.axes, type(fig.axes))
# [] <class 'list'>
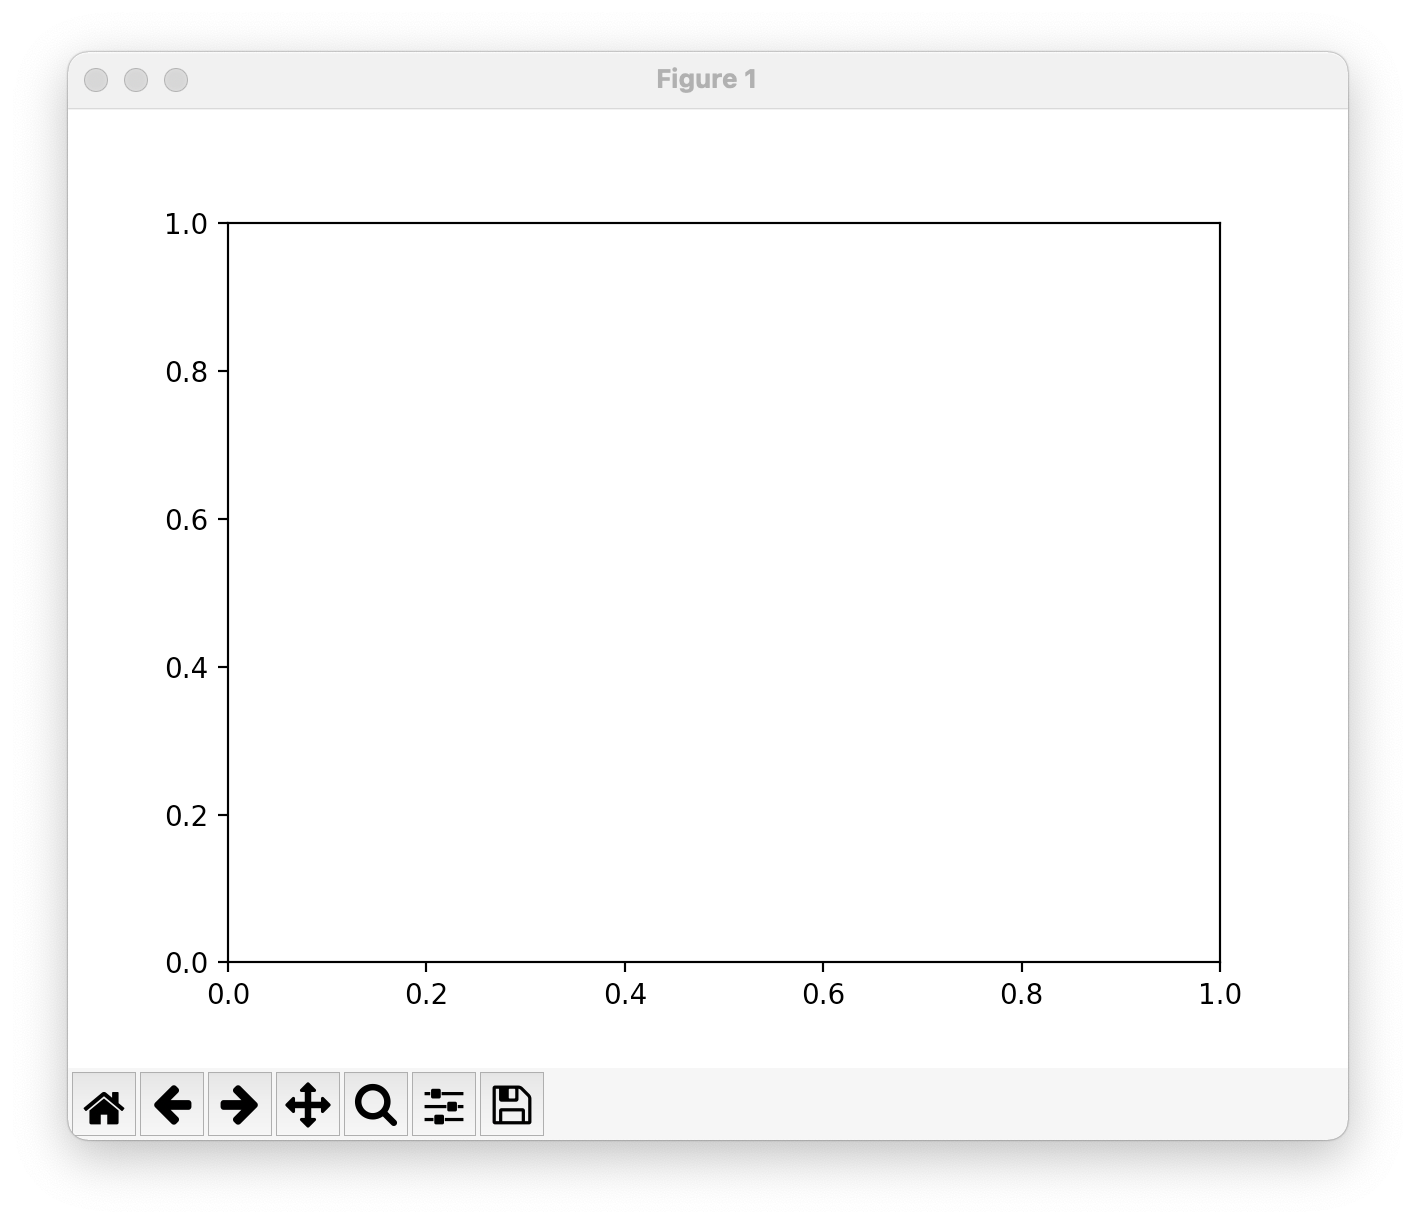
We can populate fig.axes with a default axes object. When we do, x and y coordinates are drawn onto the figure.
import matplotlib.pyplot as plt
fig = plt.figure()
fig.axes[0] = plt.axes()

print(fig.axes)  # [<AxesSubplot:>]
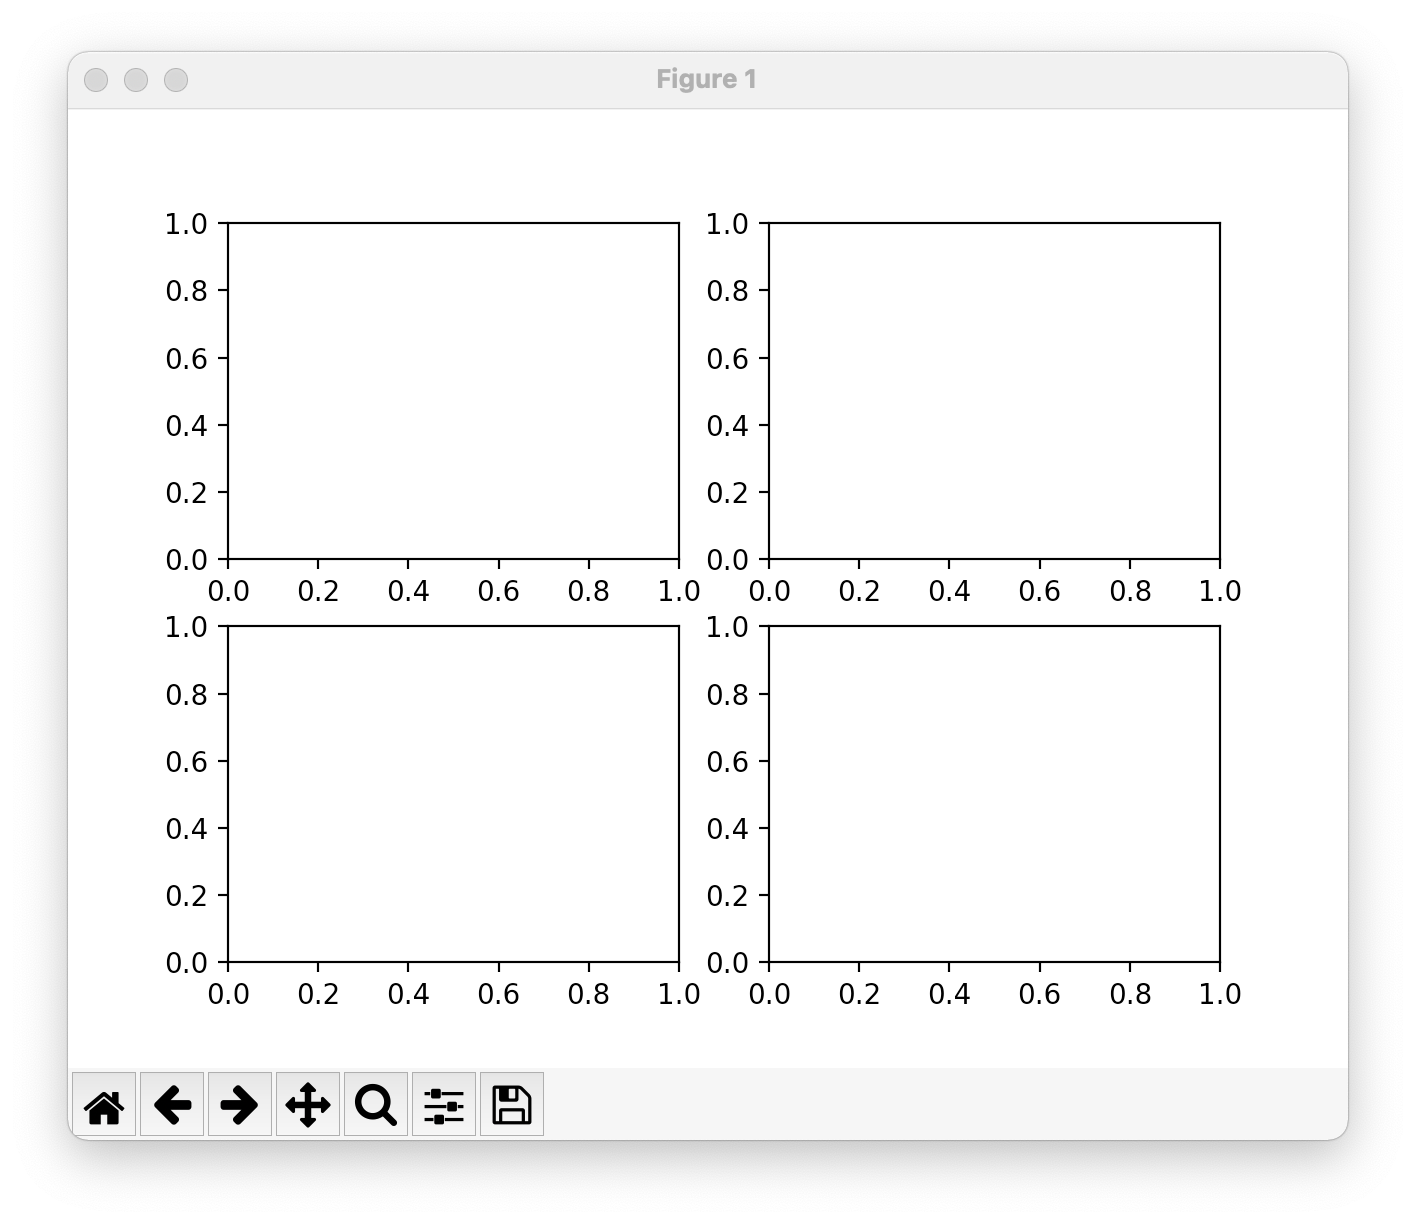
As we mentioned earlier, a single figure can contain multiple axes. For example,
import matplotlib.pyplot as plt
fig, ((ax1, ax2), (ax3, ax4)) = plt.subplots(2, 2)

print(fig.axes)
# [<AxesSubplot:>, <AxesSubplot:>, <AxesSubplot:>, <AxesSubplot:>]
Object-Oriented Style vs pyplot Style
With Matplotlib, you can build plots using the Object-Oriented style ("OO" style),
import matplotlib.pyplot as plt
fig, ax = plt.subplots()
ax.plot([1, 2, 3, 4], [1, 4, 2, 3])
ax.set_title("Hello World")
or the pyplot style
import matplotlib.pyplot as plt
plt.figure()
plt.plot([1, 2, 3, 4], [1, 4, 2, 3])
plt.title("Hello World")
The Object-Oriented approach is recommended because it provides more control over figures and axes. With that said, it's helpful to know both methods so you can distinguish between them in online documentation and code samples.
Current Figure and Current Axes
pyplot has notions of "current figure" and "current axis" which can be accessed via pyplot.gcf() and pyplot.gca().
Almost all the functions in pyplot pass through the current figure / axes (or create one) as appropriate.
For example, the below code creates a figure which then becomes the "current figure".
import matplotlib.pyplot as plt
plt.figure()

plt.gcf()  # get the current figure
# <Figure size 1280x960 with 0 Axes>
When we subsequently call plt.plot([1, 2, 3, 4], [1, 4, 2, 3]), an axes is created within the current figure, and
this becomes the current axes.
plt.plot([1, 2, 3, 4], [1, 4, 2, 3])

plt.gca()  # get the current figure
# <AxesSubplot:>
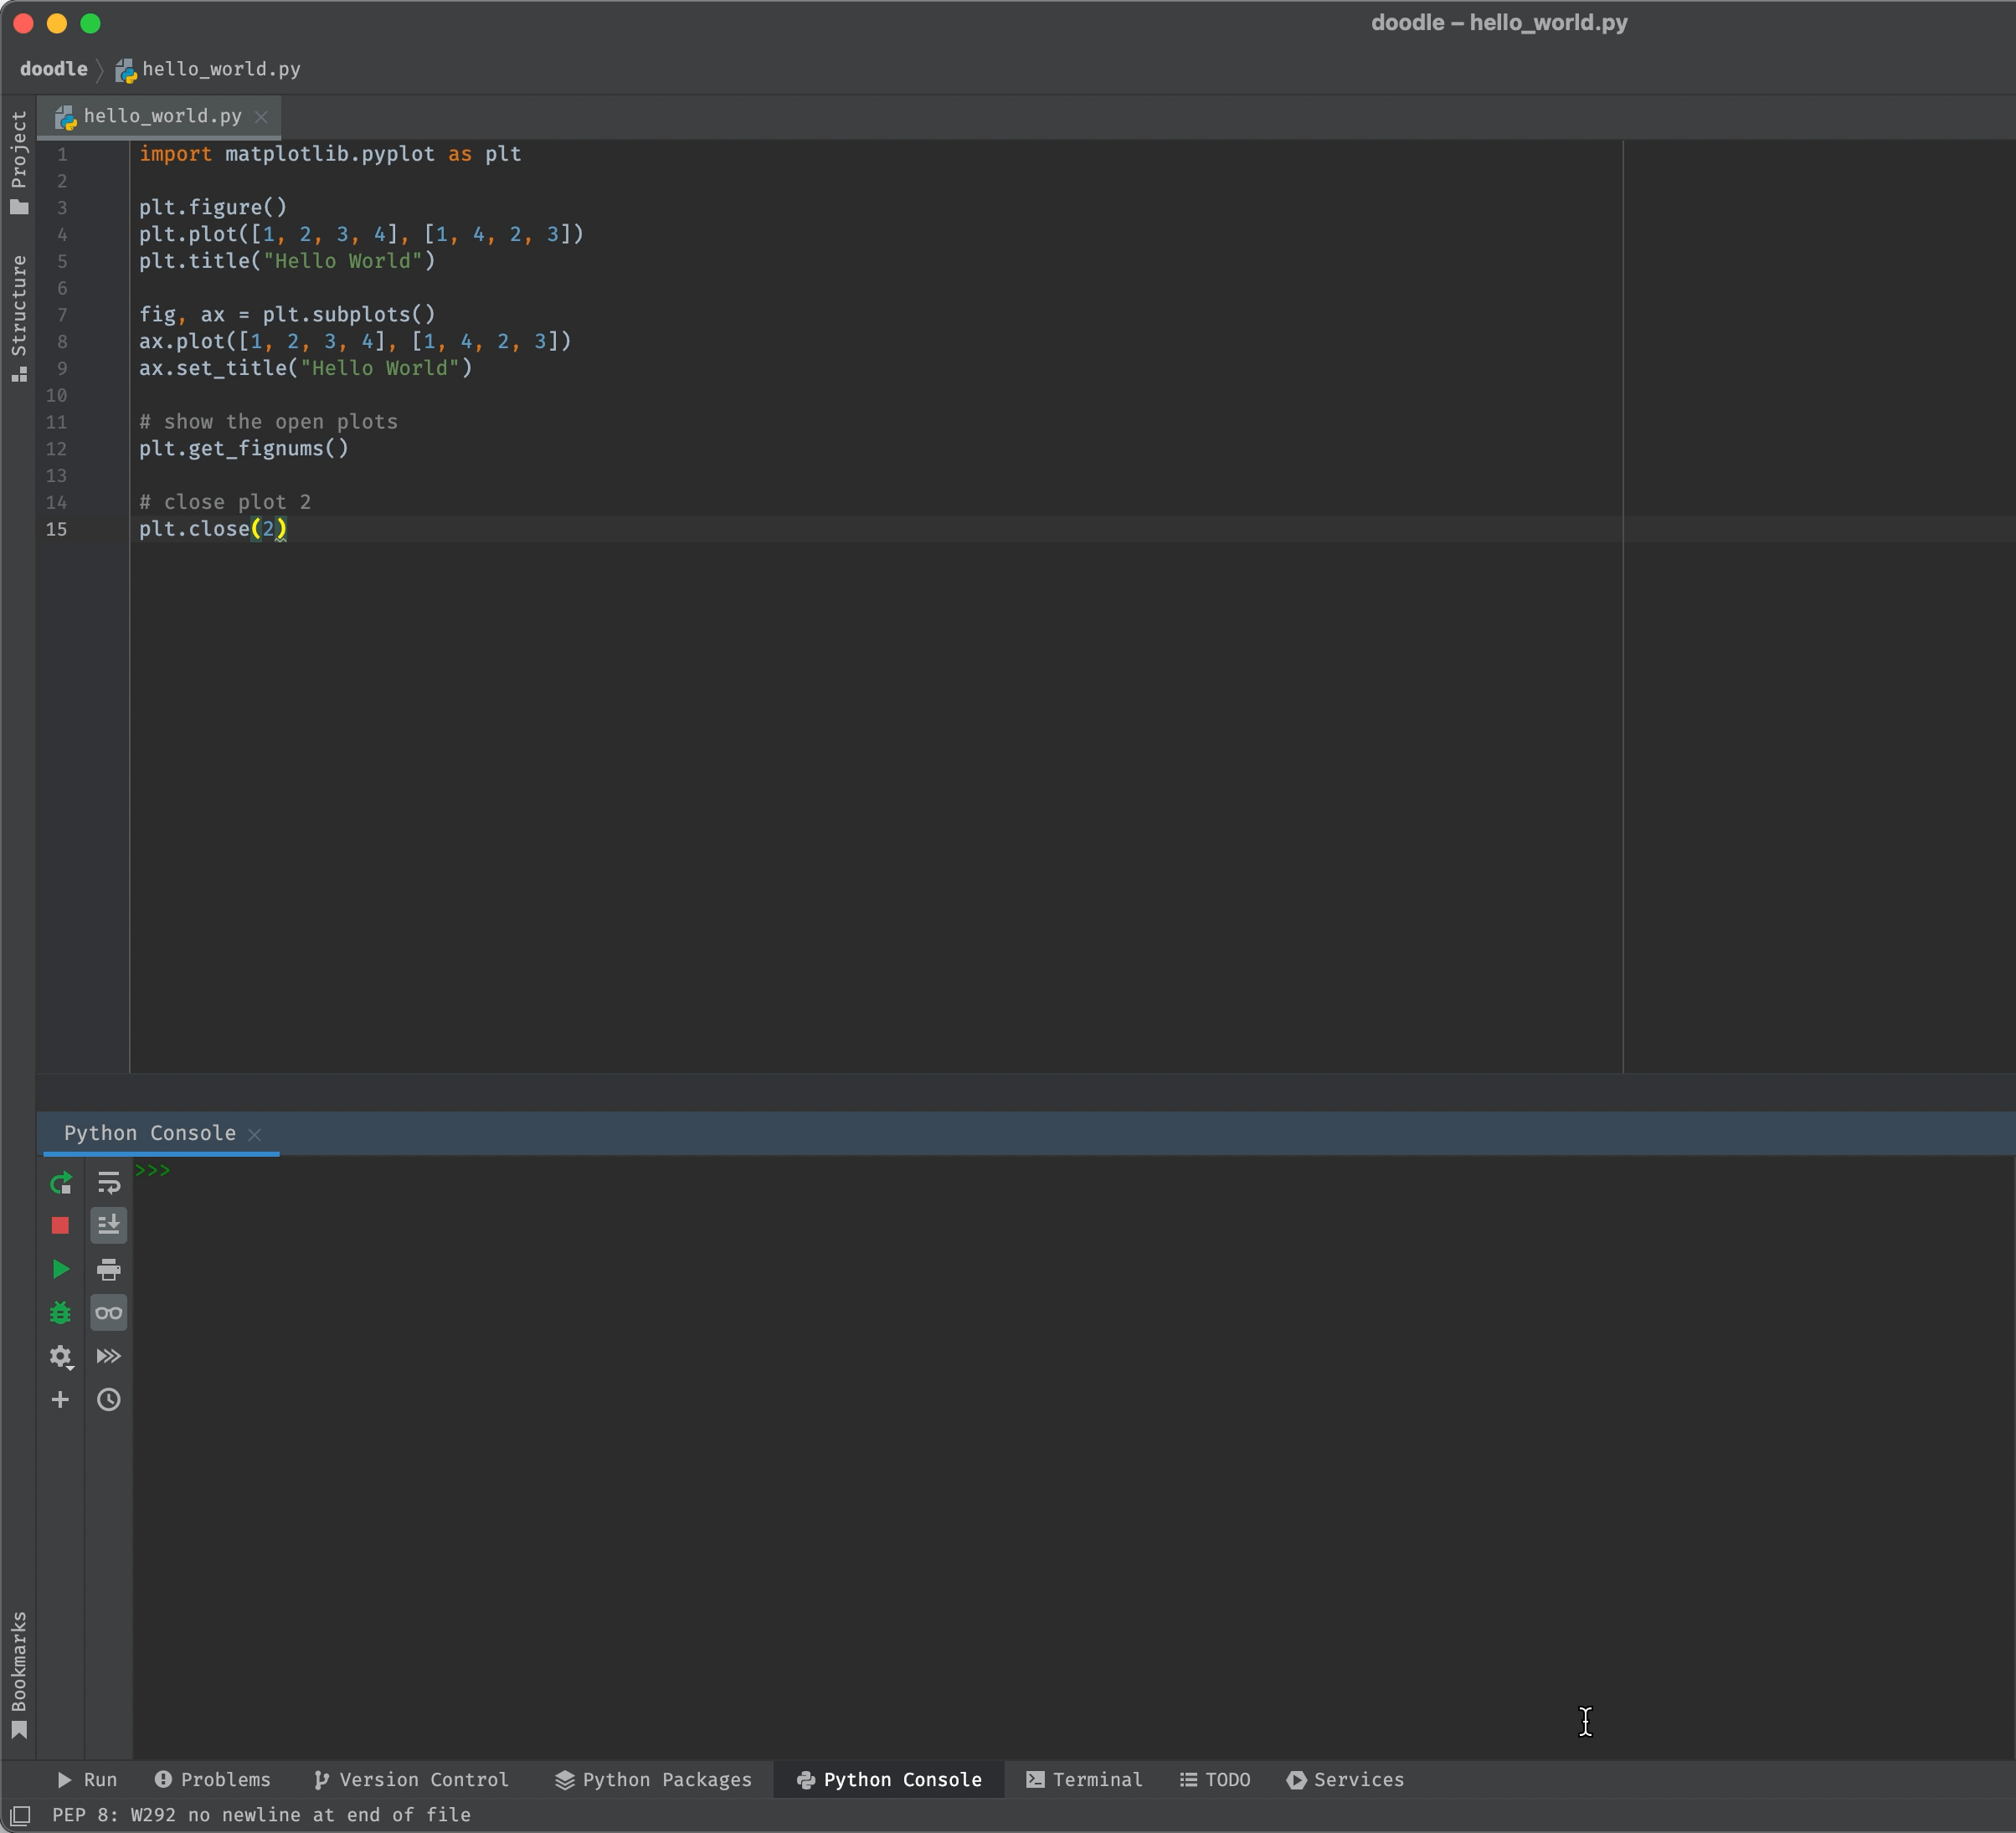
Open / Close Figures
In Matplotlib, figures are opened as soon as they're created (usually). For example, when we run this code
import matplotlib.pyplot as plt

fig, ax = plt.subplots()
ax.plot([1, 2, 3, 4], [1, 4, 2, 3])
ax.set_title("Hello World 1")

fig, ax = plt.subplots()
ax.plot([1, 2, 3, 4], [1, 4, 2, 3])
ax.set_title("Hello World 2")
we get two open figures (as indicated by two open GUI windows). pyplot.get_fignums shows each open figure as a list of
figure numbers.
plt.get_fignums()
# [1, 2]
We can close a figure by closing the GUI window or by calling pyplot.close(fig). For example,
# close figure 2
plt.close(2)