Intermediate
Colormaps
A Colormap maps values between 0 and 1 to colors. Colormaps come in two flavors:
- ListedColormap - best for a discrete color mapping
- LinearSegmentedColormap - best for a continuous color mapping
ListedColormap
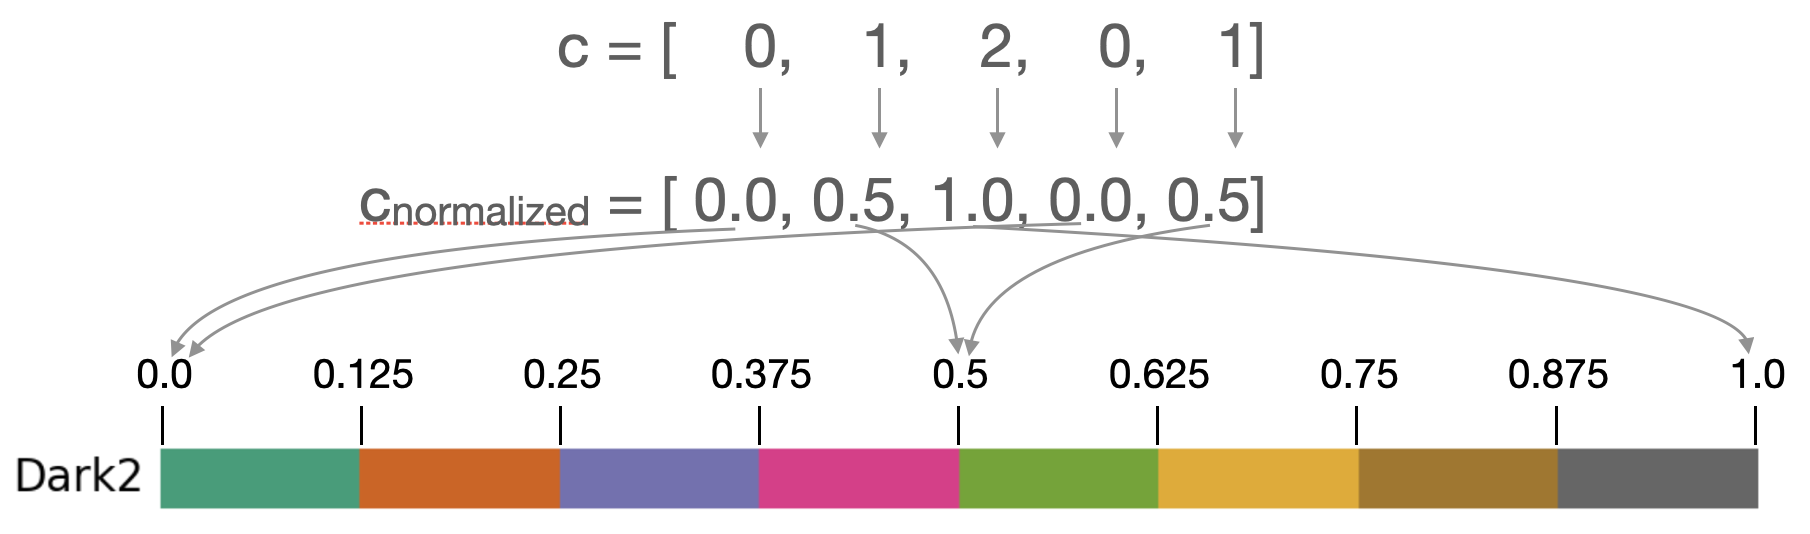
As an example, Dark2 is a ListedColormap with 8 distinct colors.

We can fetch the colormap using the matplotlib.colormaps registry (
or pyplot.colormaps). For example,
# Get the Colormap
cmap = plt.colormaps["Dark2"]

# Check its type
type(cmap) # <class 'matplotlib.colors.ListedColormap'>
Deprecation of get_cmap() function
Lots of old code use matplotlib.cm.get_cmap(), but this technique will soon be deprecated.
We can inspect its colors via the .colors attribute.
# Inspect the colors (RGB tuples)

cmap.colors
# (
#     (0.10588235294117647, 0.6196078431372549, 0.4666666666666667),
#     (0.8509803921568627, 0.37254901960784315, 0.00784313725490196),
#     (0.4588235294117647, 0.4392156862745098, 0.7019607843137254),
#     (0.9058823529411765, 0.1607843137254902, 0.5411764705882353),
#     (0.4, 0.6509803921568628, 0.11764705882352941),
#     (0.9019607843137255, 0.6705882352941176, 0.00784313725490196),
#     (0.6509803921568628, 0.4627450980392157, 0.11372549019607843),
#     (0.4, 0.4, 0.4)
# )
When we make a scatter plot, we can use cmap=plt.colormaps["Dark2"] to apply the Dark2 Colormap.
import matplotlib.pyplot as plt

fig, ax = plt.subplots()
ax.scatter(
    x=[1,2,3,4,5],
    y=[1,2,3,4,5],
    c=[0,1,2,0,1],
    cmap=plt.colormaps["Dark2"],
    s=1000
)
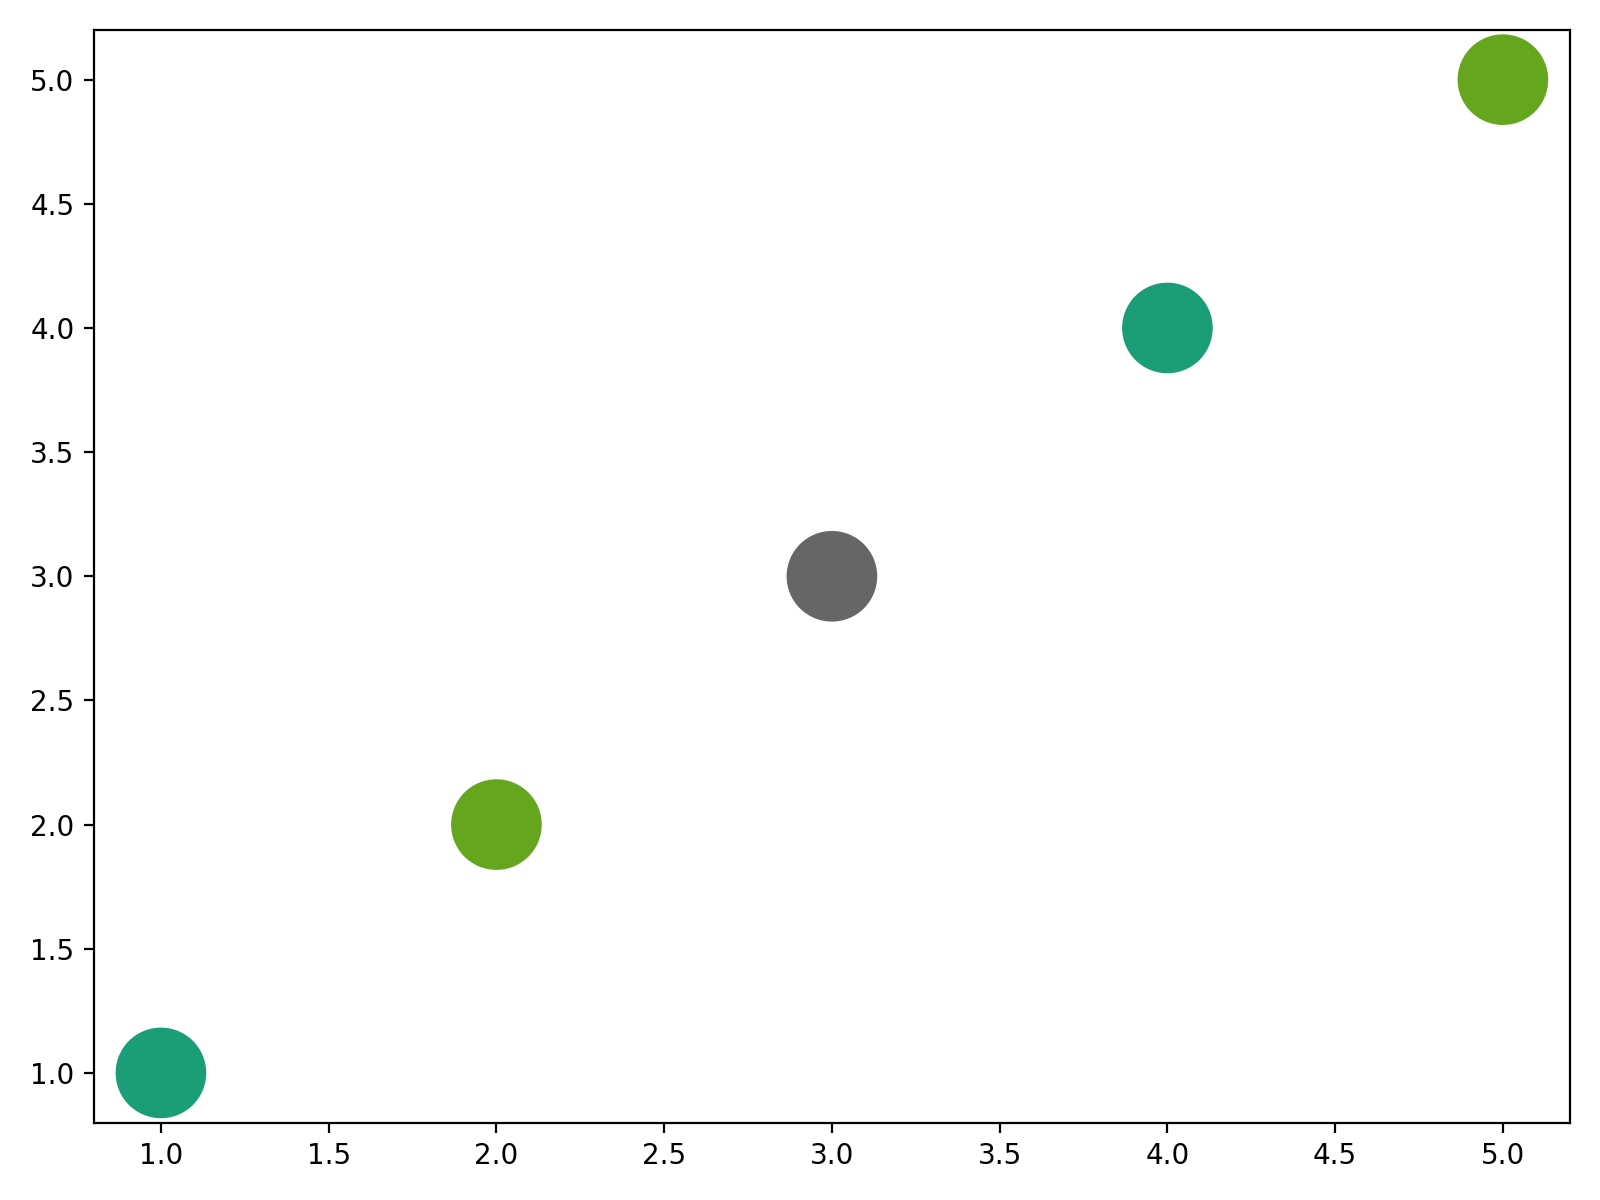
How it works
- The
cvalues are normalized to range [0, 1] using the default formula \(c_{normalized} = \frac{c - c_{min}}{c_{max} - c_{min}}\) - The normalized
cvalues are then mapped to colors using the chosen color map.
In the example above, the c=[0,1,2,0,1] is normalized into cnorm = [0., 0.5, 1., 0., 0.5]. Those normalized values
map to the following colors:
# Get the Colormap
cmap = plt.colormaps["Dark2"]
print(cmap([0., 0.5, 1., 0., 0.5]))

#   Red      Green    Blue     Alpha
# [[0.105882 0.619608 0.466667 1.      ]
#  [0.4      0.65098  0.117647 1.      ]
#  [0.4      0.4      0.4      1.      ]
#  [0.105882 0.619608 0.466667 1.      ]
#  [0.4      0.65098  0.117647 1.      ]]
LinearSegmentedColormap
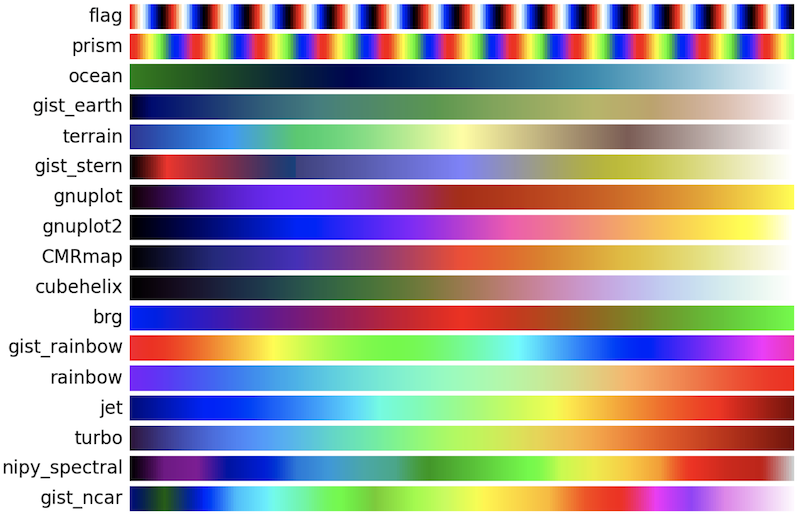
LinearSegmentedColormaps behave much like ListedColormaps, except they don't have a .colors attribute. For example,
consider the LinearSegmentedColormap rainbow.

# Get the Colormap
cmap = plt.colormaps["rainbow"]

# Check its type
type(cmap) # <class 'matplotlib.colors.LinearSegmentedColormap'>

# Inspect the colors (RGB tuples)
cmap.colors
# AttributeError: 'LinearSegmentedColormap' object has no attribute 'colors'
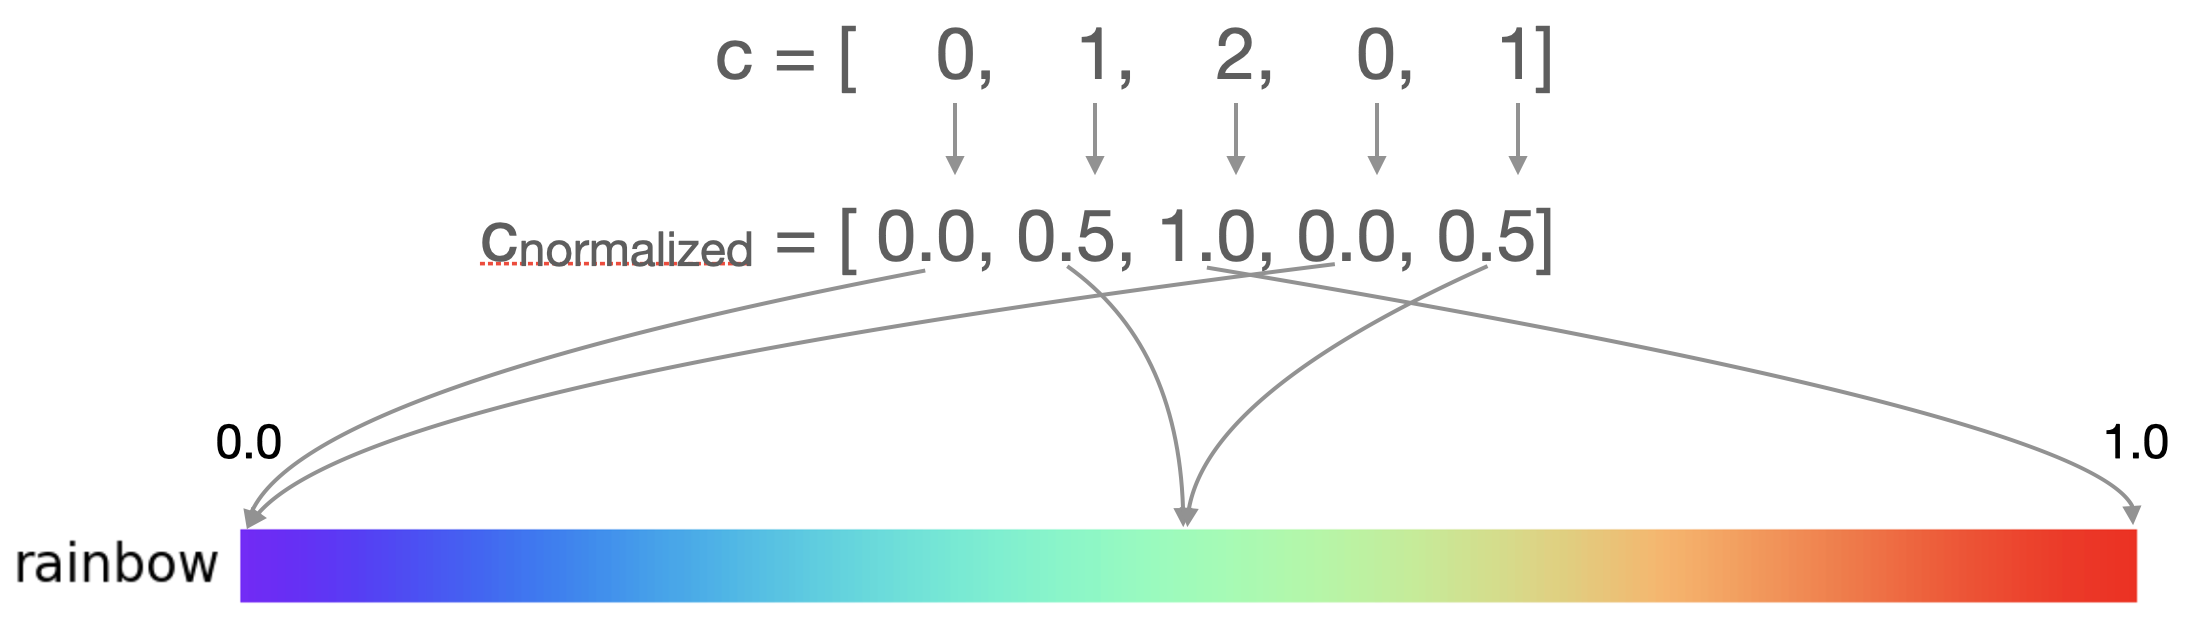
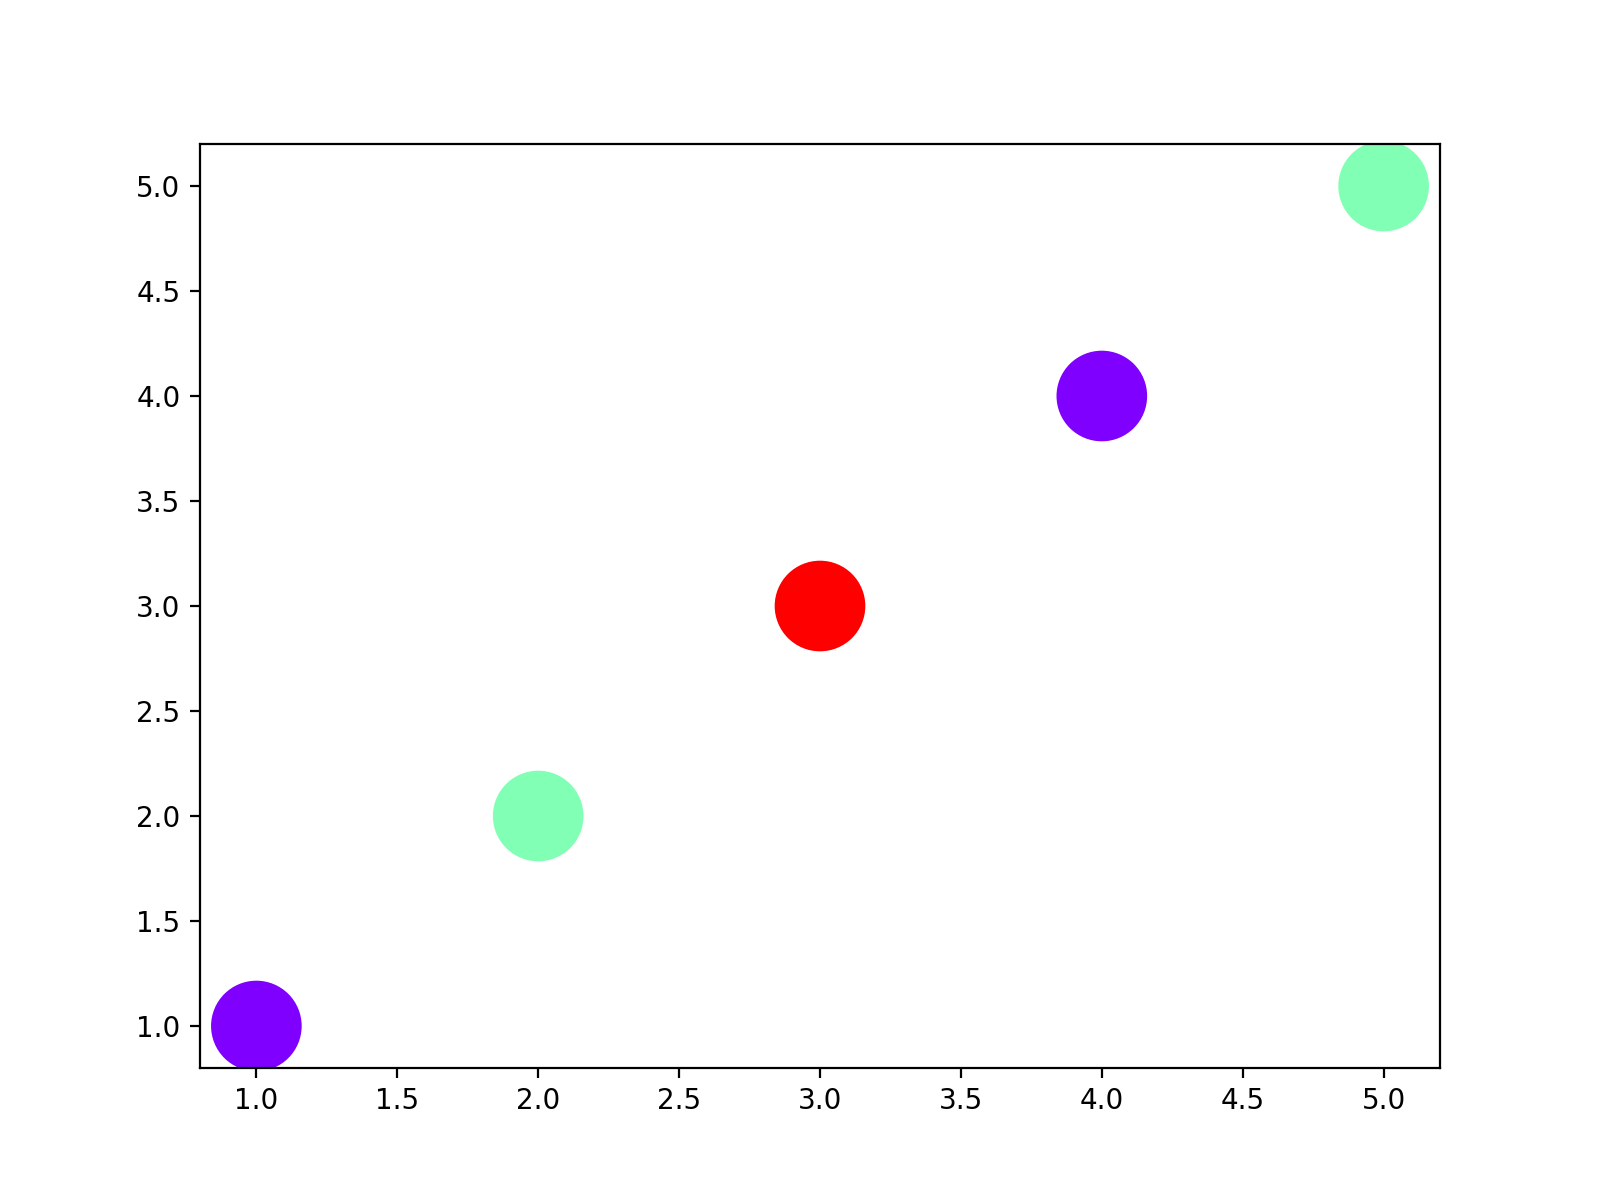
We can use cmap=plt.colormaps["rainbow"] to apply the rainbow Colormap to a scatter plot.
import matplotlib.pyplot as plt

fig, ax = plt.subplots()
ax.scatter(
    x=[1,2,3,4,5],
    y=[1,2,3,4,5],
    c=[0,1,2,0,1],
    cmap=plt.colormaps["rainbow"],
    s=1000
)
How it works
- The
cvalues are normalized to range [0, 1] using the default formula \(c_{normalized} = \frac{c - c_{min}}{c_{max} - c_{min}}\) - The normalized
cvalues are then mapped to colors using the chosen color map.
In the example above, the c=[0,1,2,0,1] is normalized into cnorm = [0., 0.5, 1., 0., 0.5]. Those normalized values
map to the following colors:
# Get the Colormap
cmap = plt.colormaps["rainbow"]
print(cmap([0., 0.5, 1., 0., 0.5]))

#   Red      Green    Blue     Alpha
# [[0.5      0.       1.       1.      ]
#  [0.503922 0.999981 0.704926 1.      ]
#  [1.       0.       0.       1.      ]
#  [0.5      0.       1.       1.      ]
#  [0.503922 0.999981 0.704926 1.      ]]